Thunderstorm-related normalized economic and insured losses in the United States east of the Rockies from the period 1970–2009 (March–September) exhibit higher peaks and greater variability in the last two decades than in the preceding two decades. To remove the bias from increasingly detected losses over time due to newly built-up locations, only large events that incurred normalized losses of at least $250 million (U.S. dollars) economically ($150 million insured) were selected. These are multistate damage events that are unlikely to have been missed at any time within the analysis period, thus providing for homogeneity of the events covered. Those losses, if aggregated, account for the major proportion (~80%) of all thunderstorm-related losses in the period 1970–2009. This study demonstrates that the pattern of variability in the time series of these losses can be seen as a reflection (“fingerprint”) of the temporal variability in severe thunderstorm forcing. The meteorological information on forcing is inferred from NCEP–NCAR reanalysis data. No final attribution of the climatic variability identified in thunderstorm forcing and losses—either to natural climate variability or to anthropogenic climate change—can be conclusively arrived at in this study because of the chosen methodology. Nevertheless, the expected impacts of anthropogenic climate change on the forcing of convective storms appear consistent with these findings.
[This message has been edited by FlyinFieros (edited 01-07-2014).]
Originally posted by rinselberg: Here's my take. Each plot, the one from 1999 and the one from 2007, both derive their base--the number that defines zero on the vertical axis of temperature anomaly--as the mean (average) temperature over the years 1951 to 1980, which is NASA's standard method for normalizing the GISS data.
There's zero evidence the first graph is using the 1951-1980 average.
The original article Arn picked the graph up from lists two graphs and gives a description. For global, it says "relative to 1951-80". For the US, it says nothing about 1951-80. But depending on how you interpret the sentence, 1951-1980 could apply to (a) and (b). You may be right, not sure what to think.
quote
Originally posted by rinselberg: But the raw dataset was corrected in 2007, apparently earlier in 2007, before the second plot was produced. Since this changed the temperatures for the years from 1951 to 1980, it also changed where the zero point falls on the vertical temperature anomaly axis.
No!
The correction only affected 2000 and onward US surface temps, by about .15°C. Globally the correction is indistinguishable. Source.
These two graphs are drastically different. The contours are different. The maximums and minimums are different.
And, they are not consistently different. The levels have been deliberately varied from year to year. They plot to try to prove that there is a warming pattern from 1974 to 2000. On the old one they show 4 years with above .5 increase over 0, from 1980 to 2000. On the newly constructed data, they show 9 years with above .5 increase.
1910 goes from 0 in the old data to .35 above in the new data while 1920 remains essentially the same in both sets of data. Why would the years change on a varying scale from one set of data to the other? The second set of data is simply doctored. You frankly insult my intelligence to try to say anything different.
Arn
[This message has been edited by Arns85GT (edited 01-07-2014).]
First off, I need to apologize to Arn for my first impression and outright dismissing his graphs as something he made up himself, which seems to be common place for his arguments.
The difference between the graphs is a newer version of data and method used.
Hansan et al 1999 used GHCN-M v2 unadjusted data and did their own adjustments. Source.
GISS currently uses GHCN-M v3 adjusted data. Source.
Why the switch? GISS gets their data from NOAA. GISS switched because NOAA stopped updating version 2 in 2011. Source.
Is there a difference between version 2 and version 3? Yes. Source.
I originally attributed the difference to one graph using the 1951-1980 base and the other didn't. It was clear there was probably some minor difference in method due to over 10 years between the two graphs. Different data and methods are used. It's still an apples to oranges comparison.
Of course that's all fuel for the conspiracy fire. The blog perpetuates the irrational fear of 'homogeneity adjustments'. But what are we really talking about here? Only United States temperature records that span less than 2% of the globe's surface. Overall it makes absolutely no difference globally: Source.
That's the denier prerogative though: Take one or two pieces of a 50,000 piece puzzle and frame those two pieces like it's a complete picture.
Isn't learning fun?
[This message has been edited by FlyinFieros (edited 01-08-2014).]
Originally posted by avengador1: One graph has been manipulated. Do a search for University of East Anglia to see the emails they found that show this.
These graphs are from NASA, not CRU. Try to keep your conspiracy theories straight.
Anyhow, on the topic of 'climategate' "Eight committees investigated the allegations and published reports, finding no evidence of fraud or scientific misconduct. The scientific consensus that global warming is occurring as a result of human activity remained unchanged throughout the investigations."
I see Flyinfieros is posting art from Columbia University. Where do you think they got their data?
Newf, the changes made change the averages over a period of time. They also create "press" releases to support an arguement.
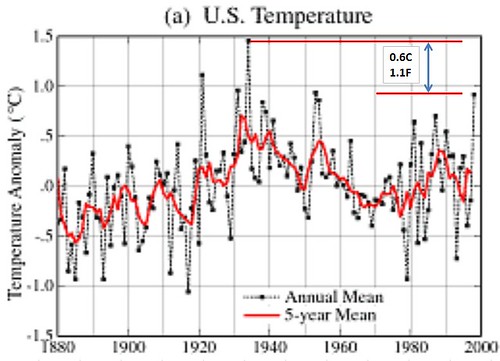
Look at 1934 vs 1997. The original data shows 1934 to be 1.1 F warmer than 1997. When you change the figure you then make a headline "1997 warmest year on record" It is propoganda.
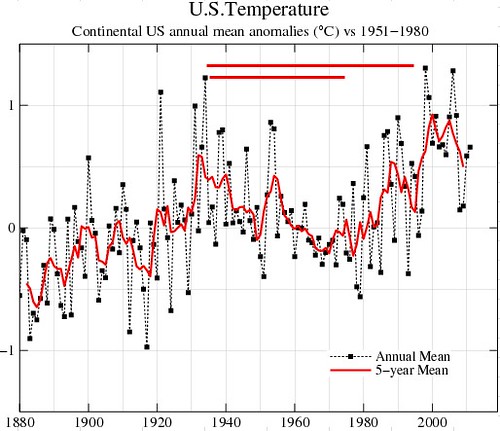
Now look at 1890
The first graph shows it to be almost at 0 level but the second graph shows it at about .3
If you continue on along the comparison, the whole average is jacked upward, again for propoganda purposes.
1900 - .4 becomes .6 but 1903 - .1 becomes -.6 a net gain of .5 in averaging.
Another example, 1910 at near 0 becomes .3 and it goes on
The pattern continues. It is complex and you have to track it, but, it is a propaganda piece nonetheless.
They try to disguise it but you should not go back and change thermometer readings to create public policy.
It is very like Obumbles stalling a pipe line which is proven to be 3x safer than rail to satisfy the Demo green lobby. It makes no sense if you look at the logic of the position, but it is driven by political policy, not science, and not practicality.
Publishing reworked false data is no help at all.
Arn
[This message has been edited by Arns85GT (edited 01-08-2014).]
Originally posted by Arns85GT: Look at 1934 vs 1997. The original data shows 1934 to be 1.1 F warmer than 1997. When you change the figure you then make a headline "1997 warmest year on record".
So why did NASA release this statement, correcting that perception?
Due to an error in calculations of mean U.S. temperatures, 1934, not 1998 as previously reported, is the hottest year on record in the United States. . . .
I see Flyinfieros is posting art from Columbia University. Where do you think they got their data?
Newf, the changes made change the averages over a period of time. They also create "press" releases to support an arguement.
Look at 1934 vs 1997. The original data shows 1934 to be 1.1 F warmer than 1997. When you change the figure you then make a headline "1997 warmest year on record" It is propoganda.
Now look at 1890
The first graph shows it to be almost at 0 level but the second graph shows it at about .3
If you continue on along the comparison, the whole average is jacked upward, again for propoganda purposes.
1900 - .4 becomes .6 but 1903 - .1 becomes -.6 a net gain of .5 in averaging.
Another example, 1910 at near 0 becomes .3 and it goes on
The pattern continues. It is complex and you have to track it, but, it is a propaganda piece nonetheless. They try to disguise it but you should not go back and change thermometer readings to create public policy.
It is very like Obumbles stalling a pipe line which is proven to be 3x safer than rail to satisfy the Demo green lobby. It makes no sense if you look at the logic of the position, but it is driven by political policy, not science, and not practicality.
Publishing reworked false data is no help at all.
Arn
So your assertion is that the numbers were adjusted by a political motive and that the adjustment is false?
Was the reasoning for the adjustment given by NASA? If not I will be happy to write them and share the reply.
Originally posted by newf: So your assertion is that the numbers were adjusted by a political motive and that the adjustment is false?
His entire argument rests on the notion the graph from 1999 he started with was 100% correct to begin with. Hansen used unadjusted data and his own adjustment method to generate the graph from 1999.
More data and better refined methods produced a result he doesn't like. So Arn favors the outdated material.
[This message has been edited by FlyinFieros (edited 01-08-2014).]
Absolutely correct. The old "outdated" material is as accurate as the scientists and meteorologists could record it at the time.
Altered data can be falsified or manipulated to support any political agenda, including Carbon Tax, Solar subsidies, Wind subsidies, Consumption tax, electric car subsidies, etc. etc.
Can be? Sure any data CAN BE. Where's your proof.?
Originally posted by Arns85GT: Absolutely correct. The old "outdated" material is as accurate as the scientists and meteorologists could record it at the time.
At the time, key words there. Methods of analysis can improve and yield a better symmetry or a different result entirely.
Originally posted by Arns85GT: Look at the data posted
The data posted shows two different methods and datasets were used to create the graphs. newf is asking you for proof the new method and dataset is fraudulent.
In the 1999 graph Hansen used GHCN-M v2 unadjusted data and his own adjustment method. The 2011+ graph is using GHCN-M v3, adjusted data straight from NOAA.
The graphs were created more than 10 years apart.
You are being asked to prove that Hansen's method with the v2 data is better than the v3 method and data.
With you being a climate science denier, there is some humor in you depending on the competence of Hansen to support your position. Even fierobear ought to find that funny.
[This message has been edited by FlyinFieros (edited 01-08-2014).]
The fraud that is “Global Warming” has been exposed by a smoking gun that even the leftist mainstream media cannot ignore. One of the major climate change advocacy centers recently had their email systems hacked and had their internal emails posted online. The University of East Anglia Climate Research Unit has been caught red-handed discussing techniques to generate fraudulent data. The New York Times quietly reported: "Officials at the University of East Anglia confirmed in a statement on Friday that files had been stolen from a university server and that the police had been brought in to investigate the breach."
The left-wing position on global warming is based upon on an appeal to authority: the “consensus” among climate scientists that global warming is real, dangerous and man-caused (anthropogenic global warming, or, AGW). Obviously, if this "consensus" is based upon the intentional suppression of alternative hypotheses, it is, quite clearly, a fraudulent one.
A 62 megabyte zip file, containing around 160 megabytes of emails, pdfs and other documents, has been confirmed as genuine by the head of the University of East Anglia’s Climate Research Unit, Dr. Phil Jones.
(Chart: lenzie.org.uk)
In an exclusive interview with Investigate magazine’s TGIF Edition, Jones confirmed his organization had been hacked, and the data flying all over the internet appears to have come from his organization. “It was a hacker. We were aware of this about three or four days ago that someone had hacked into our system and taken and copied loads of data files and emails.”
One of the best examples of the e-mails published comes from Dr. Jones himself. In an e-mail from almost exactly ten years ago, Jones appears to discuss a method of overlaying data of temperature declines with repetitive, false data of higher temperatures:
“From: Phil Jones To: ray bradley ,mann@[redacted], mhughes@[redacted] Subject: Diagram for WMO Statement Date: Tue, 16 Nov 1999 13:31:15 +0000 Cc: k.briffa@[redacted],t.osborn@[redacted]
“Dear Ray, Mike and Malcolm,
“Once Tim’s got a diagram here we’ll send that either later today or first thing tomorrow. I’ve just completed Mike’s Nature trick of adding in the real temps to each series for the last 20 years (ie from 1981 onwards) amd [sic] from1961 for Keith’s to hide the decline. Mike’s series got the annual land and marine values while the other two got April-Sept for NH land N of 20N. The latter two are real for 1999, while the estimate for 1999 for NH combined is +0.44C wrt 61-90. The Global estimate for 1999 with data through Oct is +0.35C cf. 0.57 for 1998.
“Thanks for the comments, Ray.
“Cheers, Phil Prof. Phil Jones Climatic Research Unit Telephone +44 (0) xxxxx School of Environmental Sciences Fax +44 (0) xxxx University of East Anglia Norwich Email p.jones@xxxx.xxx NR4 7TJ UK”
Did you catch that? Phil is using the “nature trick” to “hide the decline.” These are not rocket scientists. They’re B.S. artists. Here’s another sample:
“From: Tom Wigley [...] To: Phil Jones [...] Subject: 1940s Date: Sun, 27 Sep 2009 23:25:38 -0600 Cc: Ben Santer [...]
“Phil, Here are some speculations on correcting SSTs to partly explain the 1940s warming blip. If you look at the attached plot you will see that the land also shows the 1940s blip (as I’m sure you know). So, if we could reduce the ocean blip by, say, 0.15 degC, then this would be significant for the global mean – but we’d still have to explain the land blip. I’ve chosen 0.15 here deliberately. This still leaves an ocean blip, and i think one needs to have some form of ocean blip to explain the land blip (via either some common forcing, or ocean forcing land, or vice versa, or all of these). When you look at other blips, the land blips are 1.5 to 2 times (roughly) the ocean blips—higher sensitivity plus thermal inertia effects. My 0.15 adjustment leaves things consistent with this, so you can see where I am coming from. Removing ENSO does not affect this. It would be good to remove at least part of the 1940s blip, but we are still left with “why the blip”. Let me go further. If you look at NH vs SH and the aerosol effect (qualitatively or with MAGICC) then with a reduced ocean blip we get continuous warming in the SH, and a cooling in the NH—just as one would expect with mainly NH aerosols. The other interesting thing is (as Foukal et al. note – from MAGICC) that the 1910-40 warming cannot be solar. The Sun can get at most 10% of this with Wang et al solar, less with Foukal solar. So this may well be NADW, as Sarah and I noted in 1987 (and also Schlesinger later). A reduced SST blip in the 1940s makes the 1910-40 warming larger than the SH (which it currently is not)—but not really enough. So … why was the SH so cold around 1910? Another SST problem? (SH/NH data also attached.) This stuff is in a report I am writing for EPRI, so I’d appreciate any comments you (and Ben) might have. Tom.”
Global warming appears to have stopped, about ten years ago. Climatologists are puzzled as to why average global temperatures have stopped rising. Some attribute the trend to a lack of sunspots, while others explain it through ocean currents. They are in a panic to find statistical data to substantiate their loony AGW theories; and they are apparently not loathe to making stuff up.
This is a scientific scandal of the first order. The integrity of the climate scientists involved in defending the AGW theory is certainly in question. With the carbon tax “Cap and Trade” bill pending in congress, and the Copenhagen meeting just around the corner, it seems that only a fool would proceed with economy-destroying legislation which is based upon “scientific” projections that have now been proved to be fraudulent.
Author James Delingpole, writing in The London Telegraph, observes that the most damaging revelations indicate climate-change scientists may have "manipulated or suppressed evidence in order to support their cause." He argues that the world "is currently cooling; electorates are increasingly reluctant to support eco-policies leading to more oppressive regulation, higher taxes and higher utility bills; the tide is turning against Al Gore's Anthropogenic Global Warming theory. The so-called 'skeptical' view is now also the majority view."
U.S. Rep. Ron Paul, R-Texas, has urged members of Congress to consider the joint opinion of nearly 32,000 scientists, including more than 9,000 Ph.D.s, who believe humans likely have little or nothing to do with any "global warming." The Petition Project, launched some 10 years ago when the first few thousand signatures were gathered, has steadily grown without any special effort or campaign. "Our energy policies must be based upon scientific truth – not fictional movies or self-interested international agendas," Paul said. "They should be based upon the accomplishments of technological free enterprise that have provided our modern civilization, including our energy industries. That free enterprise must not be hindered by bogus claims about imaginary disasters."
The petition states: "There is no convincing scientific evidence that human release of carbon dioxide, methane, or other greenhouse gases is causing or will, in the foreseeable future, cause catastrophic heating of the Earth's atmosphere and disruption of the Earth's climate. Moreover, there is substantial scientific evidence that increases in atmospheric carbon dioxide produce many beneficial effects upon the natural plant and animal environments of the Earth."
An editorial in today’s Washington Times sums all this up pretty well:
“Scientific progress depends on accurate and complete data. It also relies on replication. The past couple of days have uncovered some shocking revelations about the baloney practices that pass as sound science about climate change.
“We don't condone e-mail theft by hackers, though these e-mails were covered by Britain's Freedom of Information Act and should have been released. The content of these e-mails raises extremely serious questions that could end the academic careers of many prominent professors. Academics who have purposely hidden data, destroyed information and doctored their results have committed scientific fraud.
“Most important, however, these revelations of fudged science should have a cooling effect on global-warming hysteria and the panicked policies that are being pushed forward to address the unproven theory."
Will this be the final nail in the coffin of Anthropenic Global Warming? Don’t bet on it. With the Copenhagen conference coming up, we should expect to see more and more hysterical (and grotesquely exaggerated) stories on AGW in the mainstream media. And look for polar bears falling from the skies…
New Study Suggests Future Global Warming at the Higher End of [latest IPCC] Estimates: 4°C Possible by 2100
"...only those climate models with high climate sensitivity correctly simulated drying in key cloud-forming regions of the atmosphere."
"...business-as-usual fossil emissions may lead to globally-averaged surface temperatures rising in excess of 4°C by 2100 - a formidable threat to global civilization."
So why did NASA release this statement, correcting that perception?
Due to an error in calculations of mean U.S. temperatures, 1934, not 1998 as previously reported, is the hottest year on record in the United States. . . .
Because they had no choice. Hansen thought he had his "smoking gun" on temperature. McIntyre once again found a math error (just like he did with the flawed tree ring proxies that flyinfieros likes to repeat over and over), and they couldn't deny it. It was a Y2K error.
[This message has been edited by fierobear (edited 01-09-2014).]
I have to find my diversion somewhere. I also get a kick out of all this nonsense because there is nothing we can do that will change what is really a natural cycle.
[This message has been edited by avengador1 (edited 01-09-2014).]
Originally posted by FlyinFieros: Only the United States, 2% of the Earth's surface area, was slightly affected. Globally the correction made absolutely zero difference. Source.
You're being deliberately manipulative with your sensationalism here. It is completely baseless. You're all talk and no evidence.
If you'd just look at through the lens of everything being some kind of liberal conspiracy I think you'll see where he's coming from.
What amazes me is some here accuse these institutions of falsifying data and then go on to use the same institutions data to support their own conclusions on the subject!
[This message has been edited by newf (edited 01-09-2014).]
I have to find my diversion somewhere. I also get a kick out of all this nonsense because there is nothing we can do that will change what is really a natural cycle.
Science clearly shows us otherwise but you are entitled to your opinion!
[This message has been edited by newf (edited 01-09-2014).]
Originally posted by newf: What amazes me is some here accuse these institutions of falsifying data and then go on to use the same institutions data to support their own conclusions on the subject!
Originally posted by Arns85GT: Correct. I'm glad you finally agree. Anthropogenic global warming is entirely artificial in its creation and has no bearing on natural events.
I said anthropogenic global warming is about as natural as plastic. I did not say plastic doesn't exist. Something can be 'unnatural' and still exist.
quote
Originally posted by Arns85GT: Welcome to the sane side
How can you welcome someone to a place you've never been?
Originally posted by Arns85GT: AGW is a concocted theory with no scientific basis, other than doctored data and fatuous scare claims that don't come true
"Climate change denial is a set of organized attempts to downplay, deny or dismiss the scientific consensus on the extent of global warming, its significance, and its connection to human behavior, especially for commercial or ideological reasons."
"Increased heating from global warming may not cause droughts but it is expected that when droughts occur they are likely to set in quicker and be more intense."
Jon Stewart, The Global Warming Hoax "Global warming alarmists continue pushing their radical position amid frigid winter conditions."
Jon Stewart, The War On Carbon "Citing brutal winter conditions and record low temperatures, Donald Trump and Jessica Williams debunk the global warming hoax once and for all."