The U.S. has never before had a President who thinks so little of the American people that he imagines he can win re-election running on the opposite of reality. But that is the reality of President Obama today.
Waving a planted press commentary, Obama recently claimed on the campaign stump, “federal spending since I took office has risen at the slowest pace of any President in almost 60 years.”
Peggy Noonan aptly summarized in last weekend’s Wall Street Journal the take away by the still holding majority of Americans living in the real world:
“There is, now, a house-of-cards feel about this administration. It became apparent some weeks ago when the President talked on the stump – where else? – about an essay by a fellow who said spending growth [under Obama] is actually lower than that of previous Presidents. This was startling to a lot of people, who looked into it and found the man had left out most spending from 2009, the first year of Mr. Obama’s Presidency. People sneered: The President was deliberately using a misleading argument to paint a false picture! But you know, why would he go out there waiving an article that could immediately be debunked? Maybe because he thought it was true. That’s more alarming, isn’t it, the idea that he knows so little about the effects of his own economic program that he thinks he really is a low spender.”
What this shows most importantly is that the recognition is starting to break through to the general public regarding the President’s rhetorical strategy that I’ve have been calling Calculated Deception. The latter is deliberately using a misleading argument to paint a false picture. That has been a central Obama practice not only throughout his entire presidency, but also as the foundation of his 2008 campaign strategy, and actually throughout his whole career.
Rest assured, Ms. Noonan, that the President is not as nuts as he may seem at times. He knows very well that he is not a careful spender. His whole mission is to transform the U.S. not into a Big Government country, but a Huge Government country, because only a country run by a Huge Government can be satisfactorily controlled by superior, all wise and beneficent individuals like himself. That is why he is at minimum a Swedish socialist, if not worse. Notice, though, how far behind the times he and his weak minded supporters are, as even the Swedes have abandoned Swedish socialism as a failure.
The analysis by Internet commentator Rex Nutting on which Obama based his claim begins by telling us “What people forget (or never knew) is that the first year of every presidential term starts with a budget approved by the previous administration and Congress.” Not exactly.
The previous administration, or President, proposes a budget. The previous Congress approves a budget. And what Congress approves can be radically different from what the President proposes.
As Art Laffer and Steve Moore showed in the Wall Street Journal on Tuesday, President Bush began a spending spree in his term that erased most of the gains in reduced government spending as a percent of GDP achieved by the Republican Congress in the 1990s led by former House Speaker Newt Gingrich, in conjunction with President Clinton. But for fiscal year 2009, President Bush in February, 2008 proposed a budget with just a 3% spending increase over the prior year. Fiscal year 2009 ran from October 1, 2008 until September 30, 2009. President Obama’s term began on January 20, 2009.
Recall, however, that in 2008 Congress was controlled by Democrat majorities, with Nancy Pelosi as Speaker of the House, and the restless Senator Obama already running for President, just four years removed from his glorious career as a state Senator in the Illinois legislature. As Hans Bader reported on May 26 for the Washington Examiner, the budget approved and implemented by Pelosi, Obama and the rest of the Congressional Democrat majorities provided for a 17.9 percent increase in spending for fiscal 2009!
Actually, President Obama and the Democrats were even more deeply involved in the fiscal 2009 spending explosion than that. As Bader also reports, “The Democrat Congress [in 2008], confident Obama was going to win in 2008, passed only three of fiscal 2009’s 12 appropriations bills (Defense, Military Construction and Veterans Affairs, and Homeland Security). The Democrat Congress passed the rest of them [in 2009], and [President] Obama signed them.” So Obama played a very direct role in the runaway fiscal 2009 spending explosion.
Note as well that President Reagan didn’t just go along with the wild spending binge of the previous Democratic Congress for fiscal year 1981 when he came into office on January 20 of that year. Almost no one remembers now the much vilified at the time 1981 Reagan budget cuts, his first major legislative initiative. Then Democrat Rep. Phil Gramm joined with Ohio Republican Del Latta to push through the Democratic House $31 billion in Reagan proposed budget cuts to the fiscal year 1981 budget, which totaled $681 billion, resulting in a cut of nearly 5% in that budget. Obama could have done the exact same thing when he entered office in January, 2009, even more so with the Congress totally controlled by his own party at the time.
Reagan then ramped up the spending cuts from there. In nominal terms, non-defense discretionary spending actually declined by 7.1% from 1981 to 1982. But roaring inflation at the time actually masks the true magnitude of the Reagan spending cut achievement. In constant dollars, non-defense discretionary spending declined by 14.4% from 1981 to 1982, and by 16.8% from 1981 to 1983. Moreover, in constant dollars, this non-defense discretionary spending never returned to its 1981 level for the rest of Reagan’s two terms! By 1988, this spending was still down 14.4% from its 1981 level in constant dollars.
Even with the Reagan defense buildup, which, remember, won the Cold War without firing a shot, total federal spending as a percent of GDP declined from a high of 23.5% of GDP in 1983 to 21.3% in 1988 and 21.2% in 1989. That’s a real reduction in the size of government relative to the economy of 10%, a huge achievement.
In sharp contrast to Reagan, Obama’s first major legislative initiative was the so-called stimulus, which increased future federal spending by nearly a trillion dollars, the most expensive legislation in history up till that point. We know now, as thinking people knew at the time, that this record shattering spending bill only stimulated government spending, deficits and debt. Contrary to official Democrat Keynesian witchcraft, you don’t promote economic recovery, growth and prosperity by borrowing a trillion dollars out of the economy to spend a trillion dollars back into it.
But this was just a warm up for Obama’s Swedish socialism. Obama worked with Pelosi’s Democratic Congress to pass an additional, $410 billion, supplemental spending bill for fiscal year 2009, which was too much even for big spending President Bush, who had specifically rejected it in 2008. Next in 2009 came a $40 billion expansion in the SCHIP entitlement program, as if we didn’t already have way more than too much entitlement spending.
But those were just the preliminaries for the biggest single spending bill in world history, Obamacare, enacted in March, 2010. That legislation is not yet even counted in Obama’s spending record so far because it mostly does not go into effect until 2014. But it is now scored by CBO as increasing federal spending by $1.6 trillion in the first 10 years alone, with trillions more to come in future years.
After just one year of the Obama spending binge, federal spending had already rocketed to 25.2% of GDP, the highest in American history except for World War II. That compares to 20.8% in 2008, and an average of 19.6% during Bush’s two terms. The average during President Clinton’s two terms was 19.8%, and during the 60-plus years from World War II until 2008 — 19.7%. Obama’s own fiscal 2013 budget released in February projects the average during the entire 4 years of the Obama Administration to come in at 24.4% in just a few months. That budget shows federal spending increasing from $2.983 trillion in 2008 to an all time record $3.796 trillion in 2012, an increase of 27.3%.
Moreover, before Obama there had never been a deficit anywhere near $1 trillion. The highest previously was $458 billion, or less than half a trillion, in 2008. The federal deficit for the last budget adopted by a Republican controlled Congress was $161 billion for fiscal year 2007. But the budget deficits for Obama’s four years were reported in Obama’s own 2013 budget as $1.413 trillion for 2009, $1.293 trillion for 2010, $1.3 trillion for 2011, and $1.327 trillion for 2012, four years in a row of deficits of $1.3 trillion or more, the highest in world history.
President Obama’s own 2013 budget shows that as a result federal debt held by the public will double during Obama’s four years as President. That means in just one term President Obama will have increased the national debt as much as all prior Presidents, from George Washington to George Bush, combined.
But this 2012 election is defined for the voters by the future, not the past. And that future is fully revealed by the stark contrast between President Obama’s spending, deficits and debt projected under his proposed 2013 budget, and the projections under House Budget Committee Chairman Paul Ryan’s budget, adopted by the Republican House, and endorsed by presumptive Republican Presidential nominee Mitt Romney.
Despite all the controversy in Washington and in the media over Ryan’s budget, what it all adds up to is just to restore federal spending to its long term, postwar, historical average of 20% of GDP. That stable level of federal spending, with some modest variance, prevailed for over 60 years after the end of World War II, until 2009. Ryan’s budget reduces federal spending from an average of 24.4% of GDP during the Obama years to 20.1% after just 3 years, by 2015.
By contrast, under the budget policies supported by President Obama and Congressional Democrats, federal spending soars to 30% of GDP by 2027, 40% by 2040, 50% by 2060, and 80% by 2080. Obama’s 2013 budget proposes to spend $47 trillion over the next 10 years, the most in world history by far, increasing federal spending by $1.5 trillion above the current CBO baseline. Ryan’s budget proposes to cut that by $6.8 trillion. By 2022, Ryan’s budget would be spending nearly a trillion dollars less per year than President Obama’s budget.
Ryan proposes tax reform to consolidate the current 6 individual income tax rates, ranging up to 35%, to just two rates of 10% and 25%. His budget would otherwise retain the Bush tax rates of 15% for capital gains and 15% for corporate dividends, and repeal the Alternative Minimum Tax. Ryan also proposes corporate tax reform, closing loopholes and reducing the federal corporate tax rate from 35% to 25%, which is roughly the international average. CBO scores these reforms, even with the rate cuts, as again restoring federal revenues to their long term, postwar, historical average of 18.3% of GDP by 2015.
Obama’s budget, in sharp contrast, proposes to increase federal taxes by nearly $2 trillion over the next 10 years above the CBO baseline. The budget projects that under Obama’s tax policies federal income tax revenues will double by 2020, federal corporate tax revenues will double by 2017, and federal payroll taxes will double by 2022.
Next year, under President Obama’s policies, the top tax rates of virtually every major federal tax are already scheduled to increase under current law. That is because the Obamacare tax increases are scheduled to go into effect, and the Bush tax cuts expire, which President Obama proposes refuses to renew for singles making over $200,000 a year, and couples making over $250,000. President Obama is now proposing on top of that the Buffett Rule, which would increase tax rates on capital gains and dividends even further. Counting that, next year the top tax rate for capital gains would increase by 100%, the top tax rate on corporate dividends would increase by 100%, the top two income tax rates would increase by nearly 20%, and the Medicare payroll tax again for singles making over $200,000 and couples making over $250,000 would increase by 62% (under Obamacare).
This is all on top of the corporate income tax rate, which counting state corporate rates is nearly 40%, the highest in the world now, except for the socialist one party state of Cameroon. Under the Buffett Rule, America’s capital gains tax rate would be the fourth highest in the industrialized world. Based on historical precedent, these tax rate increases are unlikely to raise anywhere near the revenue projected by CBO, meaning even higher future deficits and debt.
Under Ryan’s budget, even with CBO’s static scoring, the federal deficit in actual nominal dollars would be reduced to $182 billion by 2017, the fifth year of the budget. That compares to $1,327 billion, or $1.327 trillion, today. So in just 5 years, the deficit would be reduced by at least 86%. The deficit under Ryan’s budget would be less than 1% of GDP by 2017, at 0.9%, where it stabilizes for 6 years to the end of the 10 year budget window. Most importantly, given the sharp tax rate cuts in Ryan’s budget, with dynamic scoring the budget would probably be balanced by 2017. That is because in the real world the rate cuts will not lose nearly as much revenue as CBO scores.
Under President Obama’s budget, his own projections show the deficit never gets anywhere near balance. Indeed, the deficit never gets below or anywhere near the former all time record in 2008. By 2022, his own budget projects the deficit rising over the previous 5 years to $704 billion. But if Obama’s comprehensive tax rate increases throw the country back into recession next year, the deficits will soar much higher for several years, to new all time records.
Even under CBO’s horse and buggy static scoring, Ryan’s budget does serve to get federal debt under control and avoid any debt crisis, putting federal debt held by the public on a declining path from 77% of GDP in 2013 to 62% by 2022. That debt continues on a sharp decline from there, as the long term effects of Ryan’s structural entitlement reforms phase in. Debt held by the public is reduced to 53% of GDP by 2030, 38% by 2040, and 10% by 2050. That means the national debt is all but paid off by 2050, and would be soon thereafter. In fact, under dynamic scoring it probably would be paid off by then.
In stark contrast, on our current course, under President Obama’s budget policies, federal debt held by the public rockets to 140% of GDP by 2030, 220%by 2040, and 320% by 2050, on its way to over 700% by 2080. That would undoubtedly create a Grecian style sovereign debt crisis for America before that point.
So which course will you choose America?
IP: Logged
04:03 PM
PFF
System Bot
dratts Member
Posts: 8373 From: Coeur d' alene Idaho USA Registered: Apr 2001
I just want to thank you for such a short concise post. The problem I have at my age is that by the time that I get to the bottom, I have no memory or idea what was at the start.
[This message has been edited by dratts (edited 07-10-2012).]
Quick summary. "After just one year of the Obama spending binge, federal spending had already rocketed to 25.2% of GDP, the highest in American history except for World War II. That compares to 20.8% in 2008, and an average of 19.6% during Bush’s two terms. The average during President Clinton’s two terms was 19.8%, and during the 60-plus years from World War II until 2008 — 19.7%. Obama’s own fiscal 2013 budget released in February projects the average during the entire 4 years of the Obama Administration to come in at 24.4% in just a few months. That budget shows federal spending increasing from $2.983 trillion in 2008 to an all time record $3.796 trillion in 2012, an increase of 27.3%.
Moreover, before Obama there had never been a deficit anywhere near $1 trillion. The highest previously was $458 billion, or less than half a trillion, in 2008. The federal deficit for the last budget adopted by a Republican controlled Congress was $161 billion for fiscal year 2007. But the budget deficits for Obama’s four years were reported in Obama’s own 2013 budget as $1.413 trillion for 2009, $1.293 trillion for 2010, $1.3 trillion for 2011, and $1.327 trillion for 2012, four years in a row of deficits of $1.3 trillion or more, the highest in world history."
IP: Logged
05:18 PM
dratts Member
Posts: 8373 From: Coeur d' alene Idaho USA Registered: Apr 2001
Quick summary. "After just one year of the Obama spending binge, federal spending had already rocketed to 25.2% of GDP, the highest in American history except for World War II. That compares to 20.8% in 2008, and an average of 19.6% during Bush’s two terms. The average during President Clinton’s two terms was 19.8%, and during the 60-plus years from World War II until 2008 — 19.7%. Obama’s own fiscal 2013 budget released in February projects the average during the entire 4 years of the Obama Administration to come in at 24.4% in just a few months. That budget shows federal spending increasing from $2.983 trillion in 2008 to an all time record $3.796 trillion in 2012, an increase of 27.3%.
Moreover, before Obama there had never been a deficit anywhere near $1 trillion. The highest previously was $458 billion, or less than half a trillion, in 2008. The federal deficit for the last budget adopted by a Republican controlled Congress was $161 billion for fiscal year 2007. But the budget deficits for Obama’s four years were reported in Obama’s own 2013 budget as $1.413 trillion for 2009, $1.293 trillion for 2010, $1.3 trillion for 2011, and $1.327 trillion for 2012, four years in a row of deficits of $1.3 trillion or more, the highest in world history."
Raw numbers dont mean a lot to be honest. Its like saying that a movie shown in 2012 had more in sales than a show in 2000.. ticket prices are higher, so the likelyhood is they had larger sales dollars even if they sold fewer seats. ( reverse could be true in a depression.. sold more seats but brought in less in sales.. )
I'm not saying that there is an easy way to correlate the numbers, but just saying 1.3 trillion really isn't fair when you want to compare it to the past.
( not saying The O didn't destroy our economy here..... just looking for fair reporting )
Even simpler example, i used to be able to buy an entire meal for a buck not all that long ago, and get change, now its 5.. saying i spent 15 dollars this week doesn't really compare to saying i spent 5 in 1982.. so i'm unhealthy that i spent 15 dollars this week.. when i actually bought more bad food back then..
[This message has been edited by User00013170 (edited 07-08-2012).]
IP: Logged
05:32 PM
yellowstone Member
Posts: 9299 From: Düsseldorf/Germany Registered: Jun 2003
Quick summary. "After just one year of the Obama spending binge, federal spending had already rocketed to 25.2% of GDP, the highest in American history except for World War II. That compares to 20.8% in 2008, and an average of 19.6% during Bush’s two terms. The average during President Clinton’s two terms was 19.8%, and during the 60-plus years from World War II until 2008 — 19.7%. Obama’s own fiscal 2013 budget released in February projects the average during the entire 4 years of the Obama Administration to come in at 24.4% in just a few months. That budget shows federal spending increasing from $2.983 trillion in 2008 to an all time record $3.796 trillion in 2012, an increase of 27.3%.
That has a lot to do with the fact the GDP decreased in 2008/9/10 which inflates the percentage of spending vs. GDP. A recession will also automatically cause higher government spending through existing social programs, even if the administration at the time doesn't do anything.
quote
Originally posted by avengador1:Moreover, before Obama there had never been a deficit anywhere near $1 trillion. The highest previously was $458 billion, or less than half a trillion, in 2008. The federal deficit for the last budget adopted by a Republican controlled Congress was $161 billion for fiscal year 2007. But the budget deficits for Obama’s four years were reported in Obama’s own 2013 budget as $1.413 trillion for 2009, $1.293 trillion for 2010, $1.3 trillion for 2011, and $1.327 trillion for 2012, four years in a row of deficits of $1.3 trillion or more, the highest in world history."
Absolute numbers don't tell you much without factoring in inflation, purchasing power parity and relative size of the economy (I'm sure that currently the US is also the largest economy ever to exist).
Having said that, the deficit and debt are much to big, not only in the US but in many countries, mostly caused by the recent recession:
Also, someone should tell the author of the article that it's "Greek" not "Grecian".
IP: Logged
06:13 PM
Jul 9th, 2012
Toddster Member
Posts: 20871 From: Roswell, Georgia Registered: May 2001
"We're not seeing a broad-based inflation trend," - Barack Obama
do you beleive him?
Not the focus of what I wrote but anyways: about 2% inflation seems to me the "target" level of most central banks. But over time even low inflation accumulates and needs to be taken into account when making comparisons.
IP: Logged
05:03 PM
Toddster Member
Posts: 20871 From: Roswell, Georgia Registered: May 2001
Not the focus of what I wrote but anyways: about 2% inflation seems to me the "target" level of most central banks. But over time even low inflation accumulates and needs to be taken into account when making comparisons.
2% huh?
And how are you measuring inflation?
"Core" inflation is around 2%
And "Core" inflation is...well....bullshit.
Do you take food into account? The Bureau of Labor and Statistics does not Do you take energy costs into account? The BLS does not
How much do YOU pay for Gas and food lately? Gone up at all? and yet inflation is "stable"
Don't suppose it could be "stable" because of other reasons...like the COLAs?
Here is a website for ya...you seem to be better education on economics than most. But as they say, a little knowledge is a dangerous thing so read up. http://www.shadowstats.com/
IP: Logged
05:19 PM
PFF
System Bot
Jul 10th, 2012
yellowstone Member
Posts: 9299 From: Düsseldorf/Germany Registered: Jun 2003
How much do YOU pay for Gas and food lately? Gone up at all? and yet inflation is "stable"
It's dangerous to extrapolate from personal experience but... I pay much less for gas lately since I started walking and cycling to work and our food bill has been pretty stable (and I'm sure because I keep track).
Another statistic for you:
IP: Logged
10:57 PM
dratts Member
Posts: 8373 From: Coeur d' alene Idaho USA Registered: Apr 2001
That's a great trend. I just hope that it is based on mechanism of sustainable agriculture and not genetically modified plants that require more pesticides, herbicides, and petrochemical fertilizers. I know that we've genuinely had a green revolution. What I'm not sure of is whether we're turning our precious cropland into a toxic wasteland totally dependent on those artificial practices.
IP: Logged
11:21 PM
Jul 11th, 2012
E.Furgal Member
Posts: 11708 From: LAND OF CONFUSION Registered: Mar 2012
It's dangerous to extrapolate from personal experience but... I pay much less for gas lately since I started walking and cycling to work and our food bill has been pretty stable (and I'm sure because I keep track).
Another statistic for you:
WHOLESALE FOOD COST HAVE GONE UP 21%,26%,24%,28% over the last 4 years.. only the blind don't see it.. YOU might not see it. on your home budget.. but you are paying more.. the packages are smaller.. in the last 4 years I've watched breakfast box cereal drop in oz. twice.. the 5 lb bag of sugar is now 4lb.. coffee size in the can is dropped 3 times.. tho. the cans the same size. fruit/vegs in can or frozen have got smaller. packaging didn't,, produce has gone up.. (price per pound), pasta, is now a 12oz box not 16oz.. and was under a buck 4 years ago.. for price, and 2/100 in sale.. now it's 1.49 for 4 oz less thats 25% less and 33% more in cost for that 25% less in box.. spices have doubled, rice has tripled, flour has gone up 20%.. juice 18%, orange juice 45%.. just because the o.j. in the dairy is still 3.49 doesn't mean it didn't go up.. it did, the cardboard container was 68oz now some car 59 oz some are 55 oz.. and some are china oranges.. with lead added, at no charge.. sorry buddy your food bill has sky rocketed...
IP: Logged
03:24 AM
E.Furgal Member
Posts: 11708 From: LAND OF CONFUSION Registered: Mar 2012
oh and FYI we are getting in new smaller sized boxes of all 3 major brands of breakfast cereal.. to replace the older sizes.. you think the price will drop with the oz in the ox hahahahahahahaha.. keep dream'n
IP: Logged
03:27 AM
yellowstone Member
Posts: 9299 From: Düsseldorf/Germany Registered: Jun 2003
Maybe it's what we eat/buy (certainly no bags of sugar). I just checked our food expenditures since 2008 (that's when we arrived in the US) and they have been around $750/month since then, no upward trend. We buy pretty much the same things all the time and shop at Costo, Publix and Whole Foods.
But again, it's often misleading to extrapolate from own experience.
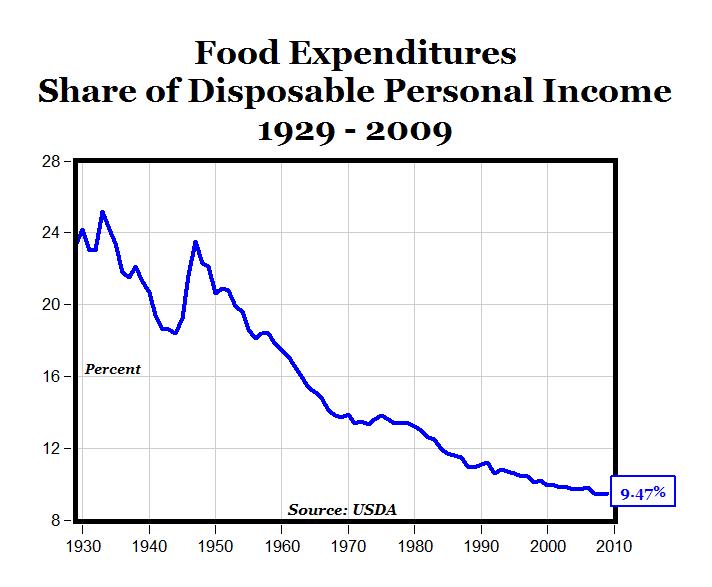
It seems that overall food expenditures are rising but this chart doesn't say if that's because of the prices or because people just buy more of it (since expenditures go down during recessions I'd guess it's the latter):
Another graph based on income levels:
quote
Originally posted by E.Furgal:
WHOLESALE FOOD COST HAVE GONE UP 21%,26%,24%,28% over the last 4 years.. only the blind don't see it.. YOU might not see it. on your home budget.. but you are paying more.. the packages are smaller.. in the last 4 years I've watched breakfast box cereal drop in oz. twice.. the 5 lb bag of sugar is now 4lb.. coffee size in the can is dropped 3 times.. tho. the cans the same size. fruit/vegs in can or frozen have got smaller. packaging didn't,, produce has gone up.. (price per pound), pasta, is now a 12oz box not 16oz.. and was under a buck 4 years ago.. for price, and 2/100 in sale.. now it's 1.49 for 4 oz less thats 25% less and 33% more in cost for that 25% less in box.. spices have doubled, rice has tripled, flour has gone up 20%.. juice 18%, orange juice 45%.. just because the o.j. in the dairy is still 3.49 doesn't mean it didn't go up.. it did, the cardboard container was 68oz now some car 59 oz some are 55 oz.. and some are china oranges.. with lead added, at no charge.. sorry buddy your food bill has sky rocketed...
[This message has been edited by yellowstone (edited 07-11-2012).]
IP: Logged
06:58 AM
E.Furgal Member
Posts: 11708 From: LAND OF CONFUSION Registered: Mar 2012
750.00 a month.. wow.. we make do on 440.oo a month and it's 3 adults... coupons and sales.. you might be staying at that 750.00 mark.. but your 750.oo is buy'n 25% less.. even goya foods the product has got smaller.. price has not.. beef, fish,poltry has gone up.. thats why I buy on sale and stock up.. the extra freezer has paid for itself 5x over
IP: Logged
09:11 AM
yellowstone Member
Posts: 9299 From: Düsseldorf/Germany Registered: Jun 2003
We're only two adults but I admit that we don't go for the cheapest stuff, e.g. we buy free-range eggs, grass-fed beef, lots of bio veggies and fruit etc.
But I would think I'd notice if we ate 25% less now than 4 years ago...
quote
Originally posted by E.Furgal:
750.00 a month.. wow.. we make do on 440.oo a month and it's 3 adults... coupons and sales.. you might be staying at that 750.00 mark.. but your 750.oo is buy'n 25% less.. even goya foods the product has got smaller.. price has not.. beef, fish,poltry has gone up.. thats why I buy on sale and stock up.. the extra freezer has paid for itself 5x over
IP: Logged
09:24 AM
E.Furgal Member
Posts: 11708 From: LAND OF CONFUSION Registered: Mar 2012
We're only two adults but I admit that we don't go for the cheapest stuff, e.g. we buy free-range eggs, grass-fed beef, lots of bio veggies and fruit etc.
But I would think I'd notice if we ate 25% less now than 4 years ago...
might be the stuff you buy was so overpriced in the first place they had more room to take the hit.
IP: Logged
09:36 AM
dratts Member
Posts: 8373 From: Coeur d' alene Idaho USA Registered: Apr 2001
Well thank you for boiling it down for me. Does that include all the military spending on our wars with the last two administrations?
No one bothered to give me an answer to my question. There was a huge military expenditure and I think I've read that it wasn't considered spending and was not included in any budgets.
IP: Logged
06:33 PM
yellowstone Member
Posts: 9299 From: Düsseldorf/Germany Registered: Jun 2003
I didn't read anything, don't know the facts, etc. That doesn't mean my opinion on this doesn't matter.
So I suppose he was supposed to follow Bush by cutting everything off? That sounds like a good idea, following the President who dug us deeper in debt than any other in history but cutting spending...
And that would help the economy how?
Spending can help get us out of this mess. Hell, if we overhauled our infrastructure and built high-speed railways throughout the country it'd provide thousands of jobs. But no, that would mean more taxes on the GOP's primary constituent! We're supposed to rely on those f*cks and their charity to give us jobs! Like giving them a tax break would make anything "trickle down" besides piss and sh*t.
IP: Logged
07:41 PM
Toddster Member
Posts: 20871 From: Roswell, Georgia Registered: May 2001
It's dangerous to extrapolate from personal experience but... I pay much less for gas lately since I started walking and cycling to work and our food bill has been pretty stable (and I'm sure because I keep track).
Another statistic for you:
And you were doing SOooooo well for a moment there Yellow. But the king of irrelevant stats could not help it.
Sigh...once again, allow me to flame the irrelvance of your post. Gas prices have fallen over the past 9 DECADES due to the increase in the number of comsumers....Econ 101, supply versus demand. YES, it still works that way despite Obama's assertions to the contrary.
Let's try THIS stat...a bit more relevant:
Average price per gallon of Gas January 2009 = $1.87 Average price per gallon of Gas January 2012 = $3.09
IP: Logged
07:43 PM
yellowstone Member
Posts: 9299 From: Düsseldorf/Germany Registered: Jun 2003
Gas prices? Where did I say something about gas prices? This graph was about food prices and, specifically, about food expenditures as a share of disposable income. I don't understand what you're trying to say...
quote
Originally posted by Toddster:
Sigh...once again, allow me to flame the irrelvance of your post. Gas prices have fallen over the past 9 DECADES due to the increase in the number of comsumers....Econ 101, supply versus demand. YES, it still works that way despite Obama's assertions to the contrary.
Let's try THIS stat...a bit more relevant:
Average price per gallon of Gas January 2009 = $1.87 Average price per gallon of Gas January 2012 = $3.09
And why should gas prices have fallen due to the increased number of consumers (= increase in demand)? Increased demand usually means rising prices. Please explain what you mean because as is it doesn't make sense.
And regarding my use of statistics: I prefer to provide some backup for my claims vs. none. At the very least it provides a basis for a discussion...
[This message has been edited by yellowstone (edited 07-11-2012).]
IP: Logged
07:52 PM
Toddster Member
Posts: 20871 From: Roswell, Georgia Registered: May 2001
Gas prices? Where did I say something about gas prices?
You responded to my post where I mentioned GAS prices.
But you are right, I did not see the "food" mentioned in the title of your graph. but it is just as irrelevant for the same reason
quote
And why should gas prices have fallen due to the increased number of consumers (= increase in demand)? Increased demand usually means rising prices. Please explain what you mean because as is it doesn't make sense.
No, A rise in demand with a constricted supply leads to increased prices. A rise in demand with EXPANDED supply should lead to lower prices. Are you seriously suggesting that the Gas supply (or food for that matter) was as massive, efficient, and easily transported in 1929 as it is today? Really?
quote
And regarding my use of statistics: I prefer to provide some backup for my claims vs. none. At the very least it provides a basis for a discussion...
True, I have seen your backup if you remember, commie websites do not count. And as for my facts...google is your friend. Feel free to find contradictory evidence....and lotsa luck with that.
IP: Logged
08:03 PM
82-T/A [At Work] Member
Posts: 25648 From: Florida USA Registered: Aug 2002
No one bothered to give me an answer to my question. There was a huge military expenditure and I think I've read that it wasn't considered spending and was not included in any budgets.
The TOTAL cost of both wars (Afghanistan and Iraq), from 2001 through present time, is currently at 1.3 trillion dollars.