
 
     |
| The evidence against anthropogenic global warming (Page 20/600) |

|
fierobear
|
SEP 03, 11:43 PM
|
|
| quote | Originally posted by ryan.hess:
"Cooling in the pacific is going to cool the globe" - Some retired Geology professor |
|
Actually, it's not just PDO. I suspect that's only one factory. The next piece of data I'm going to try to cross reference is solar. I suspect that solar cycles are driving the PDO.
As for the rest of this, I'd need to know what you are referencing (aside from the graph).
| quote | It's strange how one side rails against using limited satellite measurements, "one point measurements" (e.g. arctic temp), and skewed graphs (hockey stick).......... and yet here we are again!
Oh no! We're gonna die! |
|
But...isn't that what the warmists are saying, with the 1-4dC warming they're predicting?
|
|
|
|
ryan.hess
|
SEP 04, 12:39 AM
|
|
Put that graph on a 5 year moving average.
So 2008 was cold. 2007 was warm. Looking at some monthly chart of temperature for the last 6 years is pointless for something that happens over decadal time frames. Yes, there very well might be a trend downward that has already started, in which case - we're probably too late. Time to get out the parka because the glaciers will be knocking on my door before you know it.
It looks like there were a couple recent spikes upward that your graph doesn't show. (not that it's particularly significant, but still interesting.)

|
|
|
|
fierobear
|
SEP 04, 01:31 AM
|
|
| quote | Originally posted by ryan.hess:
It looks like there were a couple recent spikes upward that your graph doesn't show. (not that it's particularly significant, but still interesting.)
|
|
Your graph appears to be GISS data. There are questions about it, odd changes made to historical data, questions about the urban heat island effect on the data, and so on.
Following up on my last post, I've added solar data to the PDO graph:

|
|
|
|
fierobear
|
SEP 05, 02:38 PM
|
|
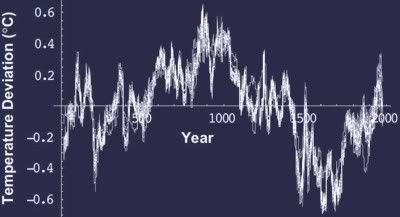
Craig Loehle paper on a 2000 year temperature reconstruction without using treering proxies. Those proxies are now considered as possibly unreliable. It would seem that Mann agrees, given that his new "hockey stick" eliminates them, or at least, there is an effort to prove temperature history without them.
Link to publication, pdf file of paper can be downloaded.
Abstract
Loehle, C. 2007. A 2000-year global temperature reconstruction based on non-treering proxies. Energy & Environment 18(7-8): 1049-1058. Note: Figure 1 data are available in a CSV file.
Loehle, C., and J.H. McCulloch. 2008. Correction to: A 2000-year global temperature reconstruction based on non-treering proxies. Energy & Environment 19(1): 93-100. Note: Supplemental data are available in a ZIP file.
Historical data provide a baseline for judging how anomalous recent temperature changes are and for assessing the degree to which organisms are likely to be adversely affected by current or future warming. Climate histories are commonly reconstructed from a variety of sources, including ice cores, tree rings, and sediment. Tree-ring data, being the most abundant for recent centuries, tend to dominate reconstructions. There are reasons to believe that tree ring data may not properly capture long-term climate changes. In this study, eighteen 2000-year-long series were obtained that were not based on tree ring data. Data in each series were smoothed with a 30-year running mean. All data were then converted to anomalies by subtracting the mean of each series from that series. The overall mean series was then computed by simple averaging. The mean time series shows quite coherent structure. The mean series shows the Medieval Warm Period (MWP) and Little Ice Age (LIA) quite clearly, with the MWP being approximately 0.3�C warmer than 20th century values at these eighteen sites.
Key graph, showing current temperatures and the medieval warm period (which Mann seems desperate to eliminate)
 [This message has been edited by fierobear (edited 09-05-2008).]
|
|
|
|
ryan.hess
|
SEP 05, 08:11 PM
|
|
Record breaking August:
http://nsidc.org/arcticseaicenews/
Following a record rate of ice loss through the month of August, Arctic sea ice extent already stands as the second-lowest on record, further reinforcing conclusions that the Arctic sea ice cover is in a long-term state of decline. With approximately two weeks left in the melt season, the possibility of setting a new record annual minimum in September remains open.
....
In a typical year, the daily rate of ice loss starts to slow in August as the Arctic begins to cool. By contrast, in August 2008, the daily decline rate remained steadily downward and strong.
The average daily ice loss rate for August 2008 was 78,000 square kilometers per day (30,000 square miles per day). This is the fastest rate of daily ice loss that scientists have ever observed during a single August. Losses were 15,000 square kilometers per day (5,800 square miles per day) faster than in August 2007, and 27,000 square kilometers per day (10,000 square miles per day) faster than average.
http://nsidc.org/images/arc...20080904_Figure5.png
http://nsidc.org/images/arc...20080904_Figure1.png
|
|

|
2.5
|
SEP 05, 08:18 PM
|
|
|
Woa, is there a "scientific thread" box I can check off?
|
|
|
|
Phranc
|
SEP 05, 08:24 PM
|
|
|
|
|
ryan.hess
|
SEP 05, 08:34 PM
|
|
| quote | Originally posted by Phranc:
 |
|
what's that, I can't read it? Some kind of temperature graph? What are you hiding?
|
|
|
|
fierobear
|
SEP 05, 08:48 PM
|
|
| quote | Originally posted by ryan.hess:
what's that, I can't read it? Some kind of temperature graph? What are you hiding? |
|
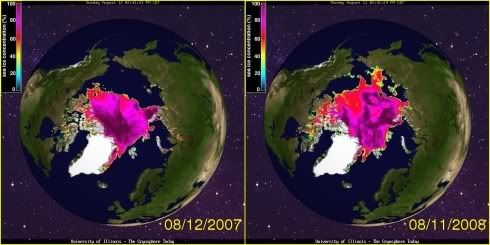
That's a photo of ice coverage of the arctic. Sure seems at odds with what you posted. Oh, and I'm pretty sure that photo is from the NSIDC, same source as yours. I just can't find the source page.
|
|
|
|
Phranc
|
SEP 05, 08:49 PM
|
|
| quote | Originally posted by ryan.hess:
what's that, I can't read it? Some kind of temperature graph? What are you hiding? |
|
Scroll up to the first time it was posted. If that is to much for you I can tell you it is a satellite composite of the actual ice cover over the Arctic from last month and the same month from the year before. More ice then last year. Last year was a record low. Last year they said this year would have no ice. This year had more ice.
I'm not hiding anything. I'm not sure what was hard about reading it. They make magnifying glassed just for computer screens. You can find them in those catalogs for old people. The kind with teatree soap and nose hair clippers and bunion cures. :P[This message has been edited by Phranc (edited 09-05-2008).]
|
|
|
|