|
| Oil price guesses 6 months 1 year (Page 2/5) |

|
ray b
|
MAR 11, 12:02 PM
|
|
current future prices
well a few min ago
the pro's say 1/2 price and bet real money on it
you can to
the first date is the ex date
L JUL22 6/21/2022 98.97 2.08 3/11/2022
MCL JUL22 6/21/2022 98.65 1.7 3/11/2022
MCL AUG22 7/19/2022 96.00 2.13 3/11/2022
CL AUG22 7/20/2022 96.24 1.82 3/11/2022
MCL SEP22 8/19/2022 92.50 1.65 3/11/2022
CL SEP22 8/22/2022 93.86 1.92 3/11/2022
MCL OCT22 9/19/2022 92.30 0.96 3/11/2022
CL OCT22 9/20/2022 91.90 2.01 3/11/2022
MCL NOV22 10/19/2022 96.00 -1.54 3/9/2022
CL NOV22 10/20/2022 90.41 2.05 3/11/2022
MCL DEC22 11/18/2022 89.12 2.26 3/11/2022
CL DEC22 11/21/2022 89.04 1.83 3/11/2022
MCL JAN23 12/19/2022 88.90 3.9 3/11/2022
CL JAN23 12/20/2022 87.81 2.16 3/11/2022
MCL FEB23 1/19/2023 83.01 -2.36 3/10/2022
CL FEB23 1/20/2023 86.48 1.84 3/11/2022
MCL MAR23 2/17/2023 85.74 7.16 3/11/2022
CL MAR23 2/21/2023 85.54 1.46 3/11/2022
MCL APR23 3/20/2023 82.91 3/10/2022
CL APR23 3/21/2023 81.29 -1.13 3/10/2022
CL MAY23 4/20/2023 90.30 -0.5 3/8/2022
MCL JUN23 5/19/2023 62.42 7/13/2021
CL JUN23 5/22/2023 83.17 1.6 3/11/2022
CL JUL23 6/20/2023 79.70 -0.38 3/10/2022
CL AUG23 7/20/2023 88.95 16.9 3/8/2022
CL SEP23 8/22/2023 79.00 -8.25 3/9/2022
CL OCT23 9/20/2023 77.50 3.29 3/1/2022
CL NOV23 10/20/2023 86.64 9.48 3/8/2022
CL DEC23 11/20/2023 79.40 1.4 3/11/2022
CL JAN24 12/19/2023 77.25 0.32 3/10/2022
CL FEB24 1/22/2024 79.85 6.23 3/3/2022
CL MAR24 2/20/2024 73.26 60.73 2/10/2022
CL APR24 3/20/2024 82.50 9.27 3/7/2022
CL MAY24 4/22/2024 72.72 9.42 2/10/2022
CL JUN24 5/21/2024 76.09 1.26 3/11/2022
CL JUL24 6/20/2024 63.50 39.68 11/4/2021
CL AUG24 7/22/2024 73.82 3/10/2022
CL SEP24 8/20/2024 79.45 3.79 3/7/2022
CL OCT24 9/20/2024 73.06 3/10/2022
CL NOV24 10/22/2024 68.48 0.78 1/27/2022
CL DEC24 11/20/2024 73.79 2.29 3/11/2022
CL JAN25 12/19/2024 69.40 2.44 2/15/2022
CL FEB25 1/21/2025 71.68 3/10/2022
CL MAR25 2/20/2025 71.32 3/10/2022
CL APR25 3/20/2025 63.85 -0.16 1/14/2022
CL MAY25 4/22/2025 70.62 3/10/2022
CL JUN25 5/20/2025 75.30 4.32 3/7/2022
CL JUL25 6/20/2025 70.08 3/10/2022
CL AUG25 7/22/2025 69.82 3/10/2022
CL SEP25 8/20/2025 69.55 3/10/2022
CL OCT25 9/22/2025 69.30 3/10/2022
CL NOV25 10/21/2025 69.06 3/10/2022
CL DEC25 11/20/2025 69.50 1.92 3/11/2022
CL JAN26 12/19/2025 54.01 0.58 6/7/2021
CL FEB26 1/20/2026 50.50 10.75 3/11/2021
CL MAR26 2/20/2026 67.87 3/10/2022
CL APR26 3/20/2026 67.60 3/10/2022
CL MAY26 4/21/2026 67.35 3/10/2022
CL JUN26 5/19/2026 60.50 11.42 11/5/2021
CL JUL26 6/22/2026 66.90 3/10/2022
CL AUG26 7/21/2026 66.71 3/10/2022
CL SEP26 8/20/2026 66.51 3/10/2022
CL OCT26 9/22/2026 66.34 3/10/2022
CL NOV26 10/20/2026 66.17 3/10/2022
CL DEC26 11/20/2026 63.50 -4.51 3/9/2022
CL JAN27 12/21/2026 54.00 7.42 5/7/2021
CL FEB27 1/20/2027 65.71 3/10/2022
CL MAR27 2/22/2027 65.50 3/10/2022
CL APR27 3/22/2027 65.31 3/10/2022
CL MAY27 4/20/2027 55.25 0.45 7/10/2019
CL JUN27 5/20/2027 65.14 3/10/2022
CL JUL27 6/22/2027 65.03 3/10/2022
CL AUG27 7/20/2027 64.81 3/10/2022
CL SEP27 8/20/2027 64.70 3/10/2022
CL OCT27 9/21/2027 55.30 0.55 7/10/2019
CL NOV27 10/20/2027 55.50 1.93 7/10/2019
CL DEC27 11/19/2027 62.00 -3.13 3/9/2022
CL JAN28 12/20/2027 54.00 3.05 5/12/2021
CL FEB28 1/20/2028 54.00 -2.88 5/12/2021
CL MAR28 2/22/2028 64.00 3/10/2022
CL APR28 3/21/2028 63.97 3/10/2022
CL MAY28 4/20/2028 63.91 3/10/2022
CL JUN28 5/22/2028 63.74 3/10/2022
CL JUL28 6/20/2028 63.77 3/10/2022
CL AUG28 7/20/2028 63.75 3/10/2022
CL SEP28 8/22/2028 63.72 3/10/2022
CL OCT28 9/20/2028 63.67 3/10/2022
CL NOV28 10/20/2028 63.64 3/10/2022
CL DEC28 11/20/2028 62.00 -9.29 3/9/2022
CL JAN29 12/19/2028 63.49 3/10/2022
CL FEB29 1/22/2029 63.47 3/10/2022
CL MAR29 2/20/2029 63.50 3/10/2022
CL APR29 3/20/2029 63.52 3/10/2022
CL MAY29 4/20/2029 63.51 3/10/2022
CL JUN29 5/22/2029 54.55 0.83 7/17/2019
CL JUL29 6/20/2029 63.35 3/10/2022
CL AUG29 7/20/2029 63.37 3/10/2022
CL SEP29 8/21/2029 63.38 3/10/2022
CL OCT29 9/20/2029 63.38 3/10/2022
CL NOV29 10/22/2029 63.37 3/10/2022
CL DEC29 11/19/2029 66.00 22.22 2/25/2022
CL JAN30 12/19/2029 63.43 3/10/2022
CL FEB30 1/22/2030 63.45 3/10/2022
CL MAR30 2/20/2030 63.44 3/10/2022
CL APR30 3/20/2030 52.80 0 4/7/2020
CL MAY30 4/22/2030 63.42 3/10/2022
CL JUN30 5/21/2030 63.42 3/10/2022
CL JUL30 6/20/2030 63.46 3/10/2022
CL AUG30 7/22/2030 63.50 3/10/2022
CL SEP30 8/20/2030 63.52 3/10/2022
CL OCT30 9/20/2030 63.54 3/10/2022
CL NOV30 10/22/2030 63.55 3/10/2022
CL DEC30 11/20/2030 57.80 7.34 11/4/2021
CL JAN31 12/19/2030 63.63 3/10/2022
CL FEB31 1/21/2031 63.71 3/10/2022
CL MAR31 2/20/2031 63.77 3/10/2022
CL APR31 3/20/2031 63.80 3/10/2022
CL MAY31 4/22/2031 63.80 3/10/2022
CL JUN31 5/20/2031 63.75 3/10/2022
CL JUL31 6/20/2031 63.76 3/10/2022
CL AUG31 7/22/2031 63.74 3/10/2022
CL SEP31 8/20/2031 63.76 3/10/2022
CL OCT31 9/22/2031 63.81 3/10/2022
CL NOV31 10/21/2031 63.90 3/10/2022
CL DEC31 11/20/2031 65.00 -5.8 3/8/2022
CL JAN32 12/19/2031 63.97 3/10/2022
CL FEB32 1/20/2032 64.14 3/10/2022
CL MAR32 2/20/2032 64.20 3/10/2022
CL APR32 3/22/2032 64.23 3/10/2022
CL MAY32 4/20/2032 64.23 3/10/2022
CL JUN32 5/20/2032 64.18 3/10/2022
CL JUL32 6/22/2032 64.19 3/10/2022
CL AUG32 7/20/2032 64.17 3/10/2022
CL SEP32 8/20/2032 64.19 3/10/2022
CL OCT32 9/21/2032 64.24 3/10/2022
CL NOV32 10/20/2032 64.33 3/10/2022
CL DEC32 11/19/2032 64.28 3/10/2022
CL JAN33 12/20/2032 64.40 3/10/2022
CL FEB33 1/20/2033 64.57 3/10/2022
|
|
|
|
Notorio
|
MAR 12, 12:51 AM
|
|
What I heard was that US oil production was down 1,000,000 barrels/day since Uncle Joe wrote his Executive Orders, switching us back to Net Importer status rather than Net Exporter status we were enjoying under the prior administration. But I haven't seen the actual data or any explanation of which Order did what (and I'm too spent after a day of on-line research to look up anything else.) Anybody found the actual data??
|
|
|
|
maryjane
|
MAR 12, 06:56 AM
|
|
| quote | | What I heard was that US oil production was down 1,000,000 barrels/day since Uncle Joe wrote his Executive Orders |
|
To exactly which executive orders are you referring?
|
|
|
|
fierobear
|
MAR 12, 09:48 AM
|
|
| quote | well a few min ago
the pro's say 1/2 price and bet real money on it |
|
Its been a long time since I tried to read “ray b-ese”” but the futures numbers are saying oil prices/barrel drop in half by fall?
|
|
|
|
fierosound
|
MAR 14, 09:53 AM
|
|
Want to save a few dollar$ ?
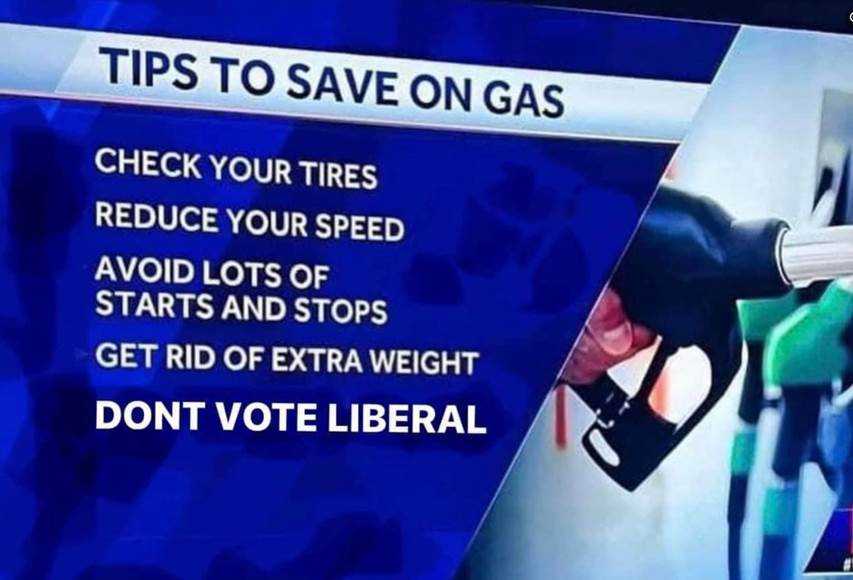 [This message has been edited by fierosound (edited 03-14-2022).]
|
|
|
|
Rickady88GT
|
MAR 14, 01:26 PM
|
|
My guess is the price projections will be met no matter what they are. Seems like projections are nothing more than goals.
Notice that the price of gas was climbing before ANY oil embargoes or sanctions on Russia. It's as predictable as the sun rising
|
|
|
|
maryjane
|
MAR 15, 04:29 PM
|
|
| quote | Originally posted by Rickady88GT:
My guess is the price projections will be met no matter what they are. Seems like projections are nothing more than goals.
Notice that the price of gas was climbing before ANY oil embargoes or sanctions on Russia. It's as predictable as the sun rising |
|
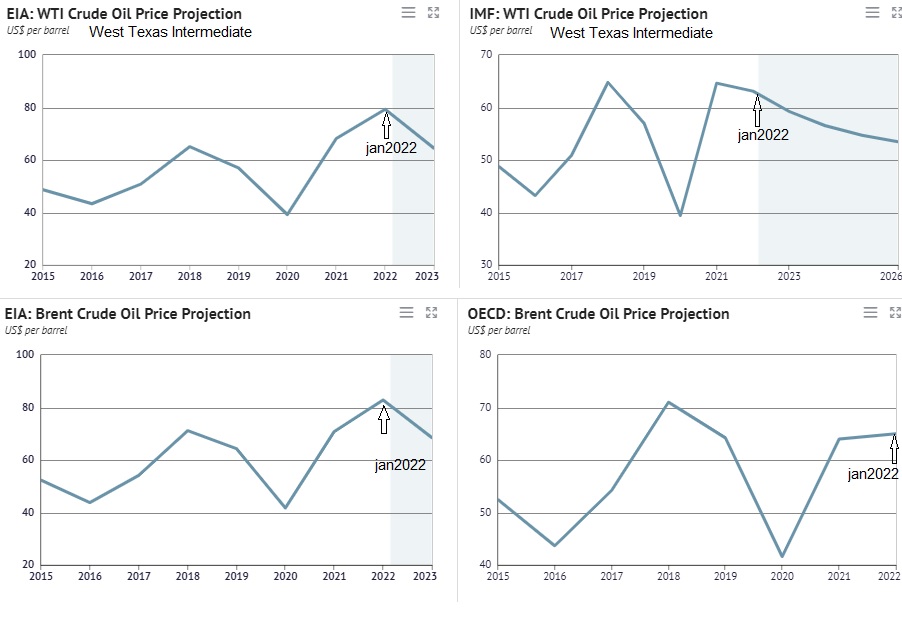
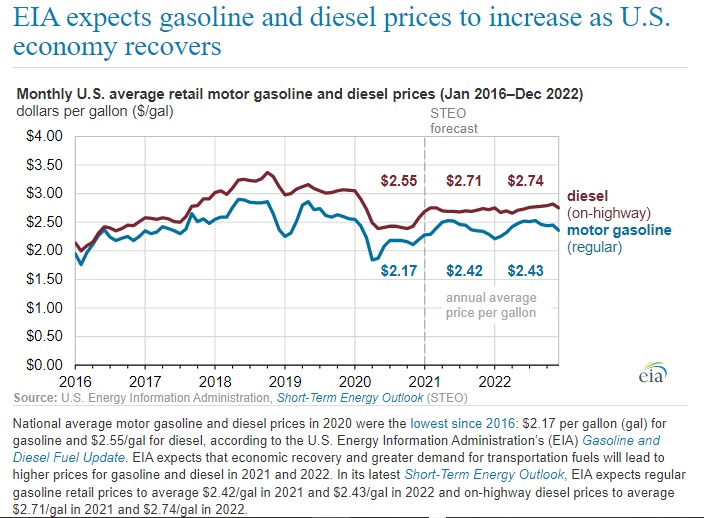
I assume what you are referring to is the crude oil futures market projections and since gasoline, doesel and other refined fuels are joined at the hip to crude prices, also the gasoline projected prices. EIA makes the long term projections.
The long term projection was for oil to actually be lower in2022 thn 2022.
Here's what they said in 2021:
| quote | (13 May 2021) Brent crude oil prices will average $62.26 per barrel in 2021 and $60.74 per barrel in 2022 according to the forecast in the most recent Short-Term Energy Outlook from the US Energy Information Administration (EIA). This represents a rebound from the 2020 average of $41.69 per barrel, but it is still lower than pre-COVID levels.
The International Monetary Fund, in its latest release of the World Economic Outlook, predicts a similar recovery scenario, with Brent oil prices rising to US$59.74 per barrel in 2021 and then to $56.23 in 2022.
Oil price forecasts depend on the interaction between supply and demand for oil in international markets. The most important supply-side factors impacting pricing in the next few years are expected to include US shale oil production, US crude oil stocks, and OPEC oil supply. |
|
The graphs from that same period of projection:
(at that time, there was expectation of Russia invading Ukraine)
|
|
|
|
Raydar
|
MAR 15, 07:05 PM
|
|
|
|
|
Raydar
|
MAR 17, 11:39 AM
|
|
|
|
|
Raydar
|
APR 03, 10:52 AM
|
|
|
~$99, today. [This message has been edited by Raydar (edited 04-03-2022).]
|
|
|