
 
     |
| The evidence against anthropogenic global warming (Page 18/600) |

|
2.5
|
AUG 12, 02:36 PM
|
|
|
That whole business from the movie Day After Tomorrow, slowly warming and then bam, Ice Age, how did that all come about, simply hollywood?
|
|
|
|
FieroFanatic13
|
AUG 12, 03:04 PM
|
|
| quote | Originally posted by 2.5:
That whole business from the movie Day After Tomorrow, slowly warming and then bam, Ice Age, how did that all come about, simply hollywood? |
|
The concept that "warming could" cause an ice age has some science to it, but not in the time frame they used in that movie. It would take a LONG time for that to happen IF it happened at all. The basic tenant being that warming might cause melting of freshwater ice that would in turn dilute the North Atlantic and slow the North Atlantic Current, thus slowing that current that carries much of the heat from the tropics to the Northern Hemisphere. This is turn could lead to cooling in the Northern Hemisphere. That is the idea they were playing off of, but they went crazy with it to say the least. Horrible "bad science" movie.
Speaking of that movie, I just loved that "super freeze" thing they did- That was just ridiculous and had no REAL scientific basis to it. They were going with some silly sudden atmospheric drop to the surface (cold upper atmospheric air dropping to the surface basically instantly) to account for their little "insta freeze." See Phranc's post below- they went with super storms that were so large they pulled air down...[This message has been edited by FieroFanatic13 (edited 08-12-2008).]
|
|
|
|
Phranc
|
AUG 12, 03:05 PM
|
|
| quote | Originally posted by 2.5:
That whole business from the movie Day After Tomorrow, slowly warming and then bam, Ice Age, how did that all come about, simply hollywood? |
|
Super low pressure spots in the cetre of hurricanes made really big by warming that sucked down super cold air from friggin space!
|
|
|
|
fierobear
|
AUG 16, 03:41 AM
|
|
For today's installment of "AGW is bullshit", let's take note how wrong they are about the predicted Arctic ice melt for this summer. They said the pole would be ice free. Ooops.
Arctic ice refuses to melt as ordered
Just a few weeks ago, predictions of Arctic ice collapse were buzzing all over the internet. Some scientists were predicting that the "North Pole may be ice-free for first time this summer". Others predicted that the entire "polar ice cap would disappear this summer".
The Arctic melt season is nearly done for this year. The sun is now very low above the horizon and will set for the winter at the North Pole in five weeks. And none of these dire predictions have come to pass. Yet there is, however, something odd going on with the ice data.
The National Snow and Ice Data Center (NSIDC) in Boulder, Colorado released an alarming graph on August 11, showing that Arctic ice was rapidly disappearing, back towards last year's record minimum. Their data shows Arctic sea ice extent only 10 per cent greater than this date in 2007, and the second lowest on record. Here's a smaller version of the graph:
Arctic ice not disappearing (SEE THE LINK FOR THE GRAPH)
The National Snow and Ice Data Center (NSIDC)'s troublesome ice graph
The problem is that this graph does not appear to be correct. Other data sources show Arctic ice having made a nice recovery this summer. NASA Marshall Space Flight Center data shows 2008 ice nearly identical to 2002, 2005 and 2006. Maps of Arctic ice extent are readily available from several sources, including the University of Illinois, which keeps a daily archive for the last 30 years. A comparison of these maps (derived from NSIDC data) below shows that Arctic ice extent was 30 per cent greater on August 11, 2008 than it was on the August 12, 2007. (2008 is a leap year, so the dates are offset by one.)
Ice at the Arctic
Ice at the Arctic: 2007 and 2008 snapshots
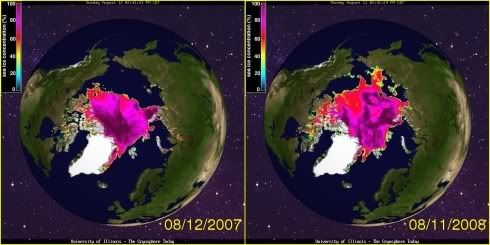
The video below highlights the differences between those two dates. As you can see, ice has grown in nearly every direction since last summer - with a large increase in the area north of Siberia. Also note that the area around the Northwest Passage (west of Greenland) has seen a significant increase in ice. Some of the islands in the Canadian Archipelago are surrounded by more ice than they were during the summer of 1980.
The 30 per cent increase was calculated by counting pixels which contain colors representing ice. This is a conservative calculation, because of the map projection used. As the ice expands away from the pole, each new pixel represents a larger area - so the net effect is that the calculated 30 per cent increase is actually on the low side.
So how did NSIDC calculate a 10 per cent increase over 2007? Their graph appears to disagree with the maps by a factor of three (10 per cent vs. 30 per cent) - hardly a trivial discrepancy.
What melts the Arctic?
The Arctic did not experience the meltdowns forecast by NSIDC and the Norwegian Polar Year Secretariat. It didn't even come close. Additionally, some current graphs and press releases from NSIDC seem less than conservative. There appears to be a consistent pattern of overstatement related to Arctic ice loss.
We know that Arctic summer ice extent is largely determined by variable oceanic and atmospheric currents such as the Arctic Oscillation. NASA claimed last summer that "not all the large changes seen in Arctic climate in recent years are a result of long-term trends associated with global warming". The media tendency to knee-jerkingly blame everything on "global warming" makes for an easy story - but it is not based on solid science. �
Bootnote
And what of the Antarctic? Down south, ice extent is well ahead of the recent average. Why isn't NSIDC making similarly high-profile press releases about the increase in Antarctic ice over the last 30 years?
The author, Steven Goddard, is not affiliated directly or indirectly with any energy industry, nor does he have any current affiliation with any university.
|
|
|
|
Phranc
|
AUG 16, 11:25 AM
|
|
| quote | Originally posted by fierobear:
The author, Steven Goddard, is not affiliated directly or indirectly with any energy industry, nor does he have any current affiliation with any university. |
|
LOL I love that last line!
|
|
|
|
Toddster
|
AUG 16, 11:34 AM
|
|
| quote | Originally posted by fierobear:
The author, Steven Goddard, is not affiliated directly or indirectly with any energy industry, nor does he have any current affiliation with any university. |
|
But he DID stay at a Holiday Inn Express! 
|
|
|
|
Arns85GT
|
AUG 16, 11:54 AM
|
|
| quote | Originally posted by ryan.hess:
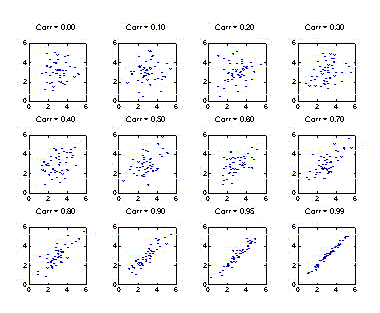
Did I say GG's caused 100% of GW? No. Are they a contributing cause? Clearly. That's my point. I think that's everyone's point. Global warming is a natural phenomenon, just like global cooling. However, the evidence points to GG's increasing the global warming beyond where they would naturally be. (See your graph, and mine.)
It's hard to argue with a 92% correlation when the sun alone has less correlation. 0.7 or 0.5 correlation is not anything to get excited about.
Various correlation coefficients:
0.92 is a much stronger case than 0.7 or 0.5. BTW, if greenhouse gases were NOT related to global warming, they'd have a correlation coefficient of 0.... or maybe 0.1. 
|
|
Ryan you have it exactly backwards. The reason GG correlates to Global Temperature is that Sunspot activity increases the earth's mean temperature and therefore plant life growth rates are boosted. The GG's follow the increase or decrease of the output of the Sun. Remember that the last iceage was caused by the virtual disappearance of Sunspots for an extended period of time. You will find that the delay in the Sunspot cycle last fall contributed to a cooler winter and still contributes to a cooler summer.
There is no science that shows that GG's lead the Sun's output. It is the other way around. The Sun's output affects many things including mean temperature, weather cycles and ocean currents. While you can argue man's influence on GG's, you can't argue man's influence on the Sun. Moreover, the percentage of man's influence on the GG's is less than 1% more along the line of .06% with nitrogen content being the lion's share of atmospheric content. Even the water vapour content affects the sun's rays. This is the reason the ground and air cool off under a cloudy day.
It is pretty hard for amateurs (like most of us here) to interpret scientific data. It is particularly difficult to determine cause and effect, and scientists are still arguing that one. One thing is certain though, the clear majority of scientists, while acknowleging Global Warming phenomenon, do not endorse Al Gore or his propaganda.
Arn
|
|
|
|
AntiKev
|
AUG 16, 01:32 PM
|
|
| quote | Originally posted by ryan.hess:
Did I say GG's caused 100% of GW? No. Are they a contributing cause? Clearly. That's my point. I think that's everyone's point. Global warming is a natural phenomenon, just like global cooling. However, the evidence points to GG's increasing the global warming beyond where they would naturally be. (See your graph, and mine.)
It's hard to argue with a 92% correlation when the sun alone has less correlation. 0.7 or 0.5 correlation is not anything to get excited about.
Various correlation coefficients:
0.92 is a much stronger case than 0.7 or 0.5. BTW, if greenhouse gases were NOT related to global warming, they'd have a correlation coefficient of 0.... or maybe 0.1.
|
|
Obviously you've never really studied statistics. Or maybe you have and just didn't get the MOST important principle for anyone who is honest about statistics.
CORRELATION DOES NOT EQUAL CAUSATION.
|
|
|
|
fierobear
|
AUG 16, 02:00 PM
|
|
| quote | Originally posted by Phranc:
LOL I love that last line! |
|
That's what it's come down to, I'm afraid. The AGW crowd's first line of defense against contrary evidence to their religion is to drop the line "funded by Exxon/Mobil".
|
|
|
|
Phranc
|
AUG 16, 02:10 PM
|
|
| quote | Originally posted by fierobear:
That's what it's come down to, I'm afraid. The AGW crowd's first line of defense against contrary evidence to their religion is to drop the line "funded by Exxon/Mobil". |
|
Just yesterday I was telling a warmist that the IPCC study was flawed. He said prove it so I flooded him with links proving it. All he did was attack the sources and claim it was neo-con BS and pointed out one guy who was obviously a liar because he worked for coal at some point. I then countered with the links about funding and how the warmists for folds more funding and how the skeptics don't get much at all. Then he stated attacking me. Not once did he attack of even acknowledge the substance against the warmist claims.
|
|
|
|