STATE COLLEGE, Pa. — THE overwhelming consensus among climate scientists is that human-caused climate change is happening. Yet a fringe minority of our populace clings to an irrational rejection of well-established science. This virulent strain of anti-science infects the halls of Congress, the pages of leading newspapers and what we see on TV, leading to the appearance of a debate where none should exist.
In fact, there is broad agreement among climate scientists not only that climate change is real (a survey and a review of the scientific literature published say about 97 percent agree), but that we must respond to the dangers of a warming planet. If one is looking for real differences among mainstream scientists, they can be found on two fronts: the precise implications of those higher temperatures, and which technologies and policies offer the best solution to reducing, on a global scale, the emission of greenhouse gases.
For example, should we go full-bore on nuclear power? Invest in and deploy renewable energy — wind, solar and geothermal — on a huge scale? Price carbon emissions through cap-and-trade legislation or by imposing a carbon tax? Until the public fully understands the danger of our present trajectory, those debates are likely to continue to founder.
This is where scientists come in. In my view, it is no longer acceptable for scientists to remain on the sidelines. I should know. I had no choice but to enter the fray. I was hounded by elected officials, threatened with violence and more — after a single study I co-wrote a decade and a half ago found that the Northern Hemisphere’s average warmth had no precedent in at least the past 1,000 years. Our “hockey stick” graph became a vivid centerpiece of the climate wars, and to this day, it continues to win me the enmity of those who have conflated a problem of science and society with partisan politics.
So what should scientists do? At one end of the spectrum, you have the distinguished former director of the NASA Goddard Institute for Space Studies, James Hansen, who has turned to civil disobedience to underscore the dangers he sees. He was arrested in 2009 protesting mountaintop removal coal mining, then again in 2011 and 2013 in Washington protesting the construction of the Keystone XL pipeline from Canada to the Texas Gulf. He has warned that the pipeline, which awaits approval by the State Department, would open the floodgates to dirty tar sands oil from Canada, something he says would be “game over for the climate.”
Dr. Hansen recently published an article in the journal PLoS One with the economist Jeffrey Sachs, director of Columbia’s Earth Institute, and other scientists, making a compelling case that emissions from fossil fuel burning must be reduced rapidly if we are to avert catastrophic climate change. They called for the immediate introduction of a price on carbon emissions, arguing that it is our moral obligation to not leave a degraded planet behind for our children and grandchildren.
This activist approach has concerned some scientists, even those who have been outspoken on climate change. One of them, Ken Caldeira of the Carnegie Institution for Science, who has argued that “the only ethical path is to stop using the atmosphere as a waste dump for greenhouse gas pollution,” expressed concern about the “presentation of such a prescriptive and value-laden work” in a paper not labeled opinion.
Are Dr. Hansen and his colleagues going too far? Should we resist commenting on the implications of our science? There was a time when I would, without hesitation, have answered “yes” to this question. In 2003, when asked in a Senate hearing to comment on a matter of policy, I readily responded that “I am not a specialist in public policy” and it would not “be useful for me to testify on that.”
It is not an uncommon view among scientists that we potentially compromise our objectivity if we choose to wade into policy matters or the societal implications of our work. And it would be problematic if our views on policy somehow influenced the way we went about doing our science. But there is nothing inappropriate at all about drawing on our scientific knowledge to speak out about the very real implications of our research.
My colleague Stephen Schneider of Stanford University, who died in 2010, used to say that being a scientist-advocate is not an oxymoron. Just because we are scientists does not mean that we should check our citizenship at the door of a public meeting, he would explain. The New Republic once called him a “scientific pugilist” for advocating a forceful approach to global warming. But fighting for scientific truth and an informed debate is nothing to apologize for.
If scientists choose not to engage in the public debate, we leave a vacuum that will be filled by those whose agenda is one of short-term self-interest. There is a great cost to society if scientists fail to participate in the larger conversation — if we do not do all we can to ensure that the policy debate is informed by an honest assessment of the risks. In fact, it would be an abrogation of our responsibility to society if we remained quiet in the face of such a grave threat.
This is hardly a radical position. Our Department of Homeland Security has urged citizens to report anything dangerous they witness: “If you see something, say something.” We scientists are citizens, too, and, in climate change, we see a clear and present danger. The public is beginning to see the danger, too — Midwestern farmers struggling with drought, more damaging wildfires out West, and withering record summer heat across the country — while wondering about possible linkages between rapid Arctic warming and strange weather patterns, like the recent outbreak of Arctic air across much of the United States.
The urgency for action was underscored this past week by a draft United Nations report warning that another 15 years of failure to cut heat-trapping emissions would make the problem virtually impossible to solve with known technologies and thus impose enormous costs on future generations. It confirmed that the sooner we act, the less it will cost.
How will history judge us if we watch the threat unfold before our eyes, but fail to communicate the urgency of acting to avert potential disaster? How would I explain to the future children of my 8-year-old daughter that their grandfather saw the threat, but didn’t speak up in time?
Those are the stakes.
[This message has been edited by FlyinFieros (edited 01-21-2014).]
Flyinfieros again spews out Mann propoganda and IPCC propoganda. Much volume doesn't mean validity
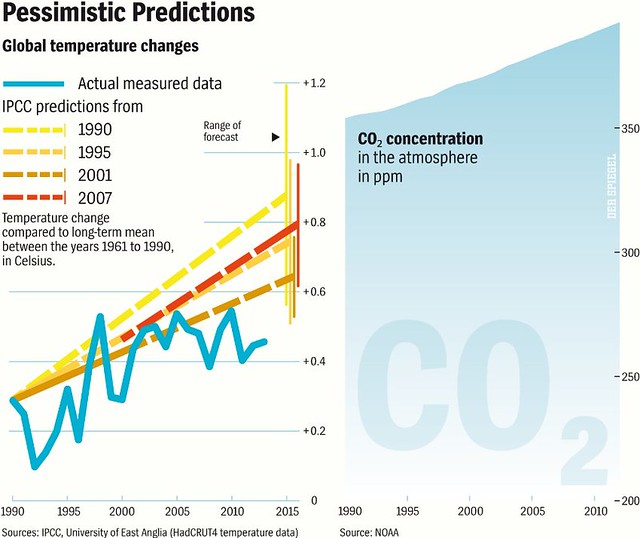
Notice that there was an uptick from 2001 to 2007 which is the years the forecasting was based on. Then there was a huge correction and oscillation. Now notice the trend since 2012. It is distinctly downward. To complicate Mann's presentations further, the IPCC now says there is no net increase since 1998.
The first rule of IPCC-deniers Club is: You do not talk about the IPCC Report.
The second rule of IPCC-deniers Club is: You do not talk about the IPCC Report.
More specifically, you do not talk about the substance of IPCC Climate Change 2013, The Physical Science Basis, which I am going to abbreviate as "PSB".
Some of the other rules of IPCC-deniers Club:
Falsify statements that you vaguely attribute to "Al Gore", or "global warming alarmists", or from some loosely written non-specialist news site, and then assert that you have falsified the general scientific consensus about MMGW, which is best represented by the IPCC: the "red herring" approach.
Wherever the IPCC makes a carefully qualified and very specific assertion, sweep aside the specifics and the qualifications to produce a statement, observation or prediction that is more extreme or more general, and attribute that assertion to the IPCC before falsifying it: the "straw man" style of argument.
There are no references to Ursus maritimus (polar bears) in the main text of the PSB, contrary to what any newcomer to this discussion might be led to expect by the many previous posts from Arns85GT: that's a red herring.
In the long bibliography of journal articles that are provided as footnotes to the PSB, just one has "polar bears" in its title.
There is not a single reference anywhere to Al Gore: IPCC-deniers Club members, please take note.
Under the heading of "Changes in Extremes", there are summary declarations of the IPCC's findings on how global temperatures have changed from 1951 to 2010 in terms of the frequency of warm vs. cold days and nights, the frequency and duration of warm spells and heat waves, heavy precipitation over land areas, dry stretches and droughts, floods, and storm activity. This entire section is carefully delimited with qualifiers, quantifiers, specitivities and notations where raw data is not available or is sparsely represented.
Here's what the IPCC actually says about the frequency and intensity of cyclones (aka: hurricanes and typhoons)--a favorite topic of Arns of 85GT--and other storms: not in the way of prediction, but as observed to date:
quote
Confidence remains low for long-term (centennial) changes in tropical cyclone activity, after accounting for past changes in observing capabilities. However, since the 1970s, it is virtually certain that the frequency and intensity of storms in the North Atlantic has increased although the reasons for this increase are debated... There is low confidence of large-scale trends in storminess over the last century and there is still insufficient evidence to determine whether robust trends exist in small-scale severe weather events such as hail or thunder storms.
Here are a few additional excerpts:
Evidence for a warming world comes from multiple independent climate indicators, from high up in the atmosphere to the depths of the oceans. They include changes in surface, atmospheric, and oceanic temperatures, glaciers, snow cover, sea ice, sea level, and atmospheric water vapour.
The observations... provide strong evidence that ocean properties of relevance to climate have changed during the past forty years, including temperature, salinity, sea level, carbon, pH, and oxygen. The observed patterns of change in the subsurface ocean are consistent with changes in the surface ocean in response to climate change and natural variability and with known physical and biogeochemical processes in the ocean, providing high confidence in this assessment.
Global mean sea level has risen by 0.19... [meters] over the period 1901-2010... based on tide gauge records and since 1993 additionally on satellite data. It is very likely that the mean rate was 1.7... [millimeters per year] between 1901 and 2010 and increased to 3.2... [millimeters per year] between 1993 and 2010.
It is very likely that oceanic uptake of anthropogenic CO2 results in gradual acidification of the ocean. The pH of seawater has decreased by 0.1 since the beginning of the industrial era, corresponding to a 26% increase in hydrogen ion concentration.
Since the [previous IPCC Assessment Report "Climate Change 2007"], observational technology has improved and key time-series of measurements have been lengthened, such that our identification and measurement of changes and trends in all components of the cryosphere [snow, river and lake ice, sea ice, glaciers, ice shelves and ice sheets, and permafrost] has been substantially improved, and our understanding of the specific processes governing their responses has been refined. Since the [2007], observations show that there has been a continued net loss of ice from the cryosphere, although there are significant differences in the rate of loss between cryospheric components and regions.
Earth has been in radiative imbalance, with more energy from the sun entering than exiting the top of the atmosphere, since at least circa 1970. It is virtually certain that Earth has gained substantial energy from 1971-2010... Ocean warming dominates that total heating rate, with full ocean depth warming accounting for about 93% (and warming of the upper 0-700 [meters] ocean accounting for about 64%). Melting ice (including Arctic sea ice, ice sheets, and glaciers) and warming of the continents each account for 3% of the total. Warming of the atmosphere makes up the remaining 1%.
The rate of ocean warming in some of the 0-700 [meters] estimates was lower from 2003 to 2010 than in the previous decade...; however, warming in the subsurface layer between 700 and 2000 [meters] likely continued unabated during this period.
It is certain that Global Mean Surface Temperature (GMST) has increased since the late 19th century (...). Each of the past three decades has been warmer than all the previous decades in the instrumental record, and the decade of the 2000's has been the warmest. The global combined land and ocean temperature data show an increase of about 0.89 [Celsius]... over the period 1901-2012 and about 0.72 [Celsius]... over the period 1951-2012 when described by a linear trend. The warming from 1850-1900 (early industrial) to 1986-2005 (reference period...) is 0.61 [Celsius]..., when calculated using HadCRUT4 and its uncertainty estimates. It is also virtually certain that maximum and minimum temperatures over land have increased on a global scale since 1950.
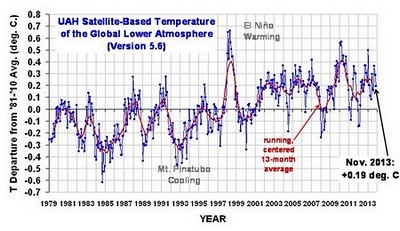
The warming "hiatus" UAH satellite-based temperature of the global lower atmosphere, 1979 to 2013 (December): CLICK TO VIEW DATA PLOT IN A NEW BROWSER WINDOW http://imageshack.com/a/img809/2461/l954.png
Despite the robust multi-decadal timescale, there exists substantial inter annual to decadal variability in the rate of warming, with several periods exhibiting weaker trends (including the warming hiatus since 1998)... Although the trend uncertainty is large for short records, the rate of warming over the past 15 years (1998-2012: 0.05 [Celsius] per decade...) is smaller than the trend since 1951 (1951-2012: 0.12 [Celsius] per decade...). Several independently analyzed data records of global and regional land surface temperatures obtained from station observations are in broad agreement that land surface air temperatures have increased. Sea surface temperatures have also increased. Intercomparisons of new sea surface temperature data records obtained by different measurement methods, including satellite data, have resulted in better understanding of errors and biases in the records (...).
"I have never posted that I could personally marshal enough scientific information to validate all--or even any one--of the findings about global warming from NASA or the IPCC. But I try not to be deceived by half-baked arguments in the opposite direction." (rinselberg)
[This message has been edited by rinselberg (edited 01-22-2014).]
Human influence on the climate system is clear. This is evident in most regions of the globe, a new assessment by the [IPCC] concludes.
It is extremely likely that human influence has been the dominant cause of the observed warming since the mid-20th century. The evidence for this has grown, thanks to more and better observations, an improved understanding of the climate system response and improved climate models.
Warming in the climate system is unequivocal and since 1950 many changes have been observed throughout the climate system that are unprecedented over decades to millennia. Each of the last three decades has been successively warmer at the Earth's surface than any preceding decade since 1850...
Observations of changes in the climate system are based on multiple lines of independent evidence. Our assessment of the science finds that the atmosphere and oceans have warmed, the amount of snow and ice has diminished, the global mean sea level has risen and the concentrations of greenhouse gases have increased.
That (going back to back with my previous post) is what the IPCC says has already happened.
Now for some predictions:
Continued emissions of greenhouse gases will cause further warming and changes in all components of the climate system. Climate mitigation [limiting climate change] will require substantial and sustained reductions of greenhouse gas emissions.
Global surface temperature change for [year 2100] is projected to be likely to exceed 1.5 [Celsius] relative to 1850 to 1900 in all but the [most stringent climate mitigation] scenario considered, and likely to exceed 2 (Celsius) for the two [least stringent mitigation] scenarios. Heat waves are very likely to occur more frequently and last longer. As the Earth warms, we expect to see currently wet regions receiving more rainfall, and dry regions receiving less, although there will be exceptions.
Projections of climate change are based on a new set of four scenarios of future greenhouse gas concentrations and aerosols, spanning a wide range of possible futures...
As the ocean warms, and glaciers and ice sheets reduce, global mean sea level will continue to rise, but at a faster rate than we have experienced over the past 40 years... The report finds with high confidence that ocean warming dominates the increase in energy stored in the climate system, accounting for more than 90% of the energy accumulated between 1971 and 2010.
But...it was really cold this morning. And it was so cold in Norway that some fish were frozen to death. AGW is a hoax and Limbaugh confirmed it this morning on the way to work.
Big thanks to Mann for tolerating a lot of undue harassment throughout this scientific endeavor. He's kept his sense of humor though:
I've had enough of flyinfieros and his Mann-crush. Michael Mann is a FRAUD, and he should be in JAIL for what he's done to science. And since flyinfieros insists on supporting Mann, and repeating his bullshit over and over, it's time to revisit Mann's infamous "hockey stick graph", and repost how and why it is a FRAUD. flyinfieros support and reposting of this fraud means he's no less a fraud than Mann. What I'm posting is well documented, and the skeptics show their work.
flyinfieros has been shown this proof, and continues to post this crap. If he reposts this fraud, then he is just as guilty of fraud.
he rise and fall of the Hockey Stick and Mann-made global warming alarm A first-class summary of the rise and fall of Michael Mann's bogus Hockey Stick graph, and the Mann-made global warming alarm along with it, reblogged from A Skeptical Mind:
The rise and fall of the Hockey Stick The rise of the so called Hockey Stick graph is pivotal to the story of the rise of the alarm about man made global warming. The fall of the Hockey Stick graph is pivotal to the rise of scepticism about man made global warming. Here is the story of the rise and fall of the Hockey Stick.
The Background A central and critical plank of the alarmist global warming case is that the current phase of warming that started in the late 19th century is unprecedented. Why is this claim so important? Because if a similar or greater warming phase has occurred in the very recent past, before human CO2 emissions had caused CO2 levels to rise, then clearly any such recent warming must have been natural and was not caused by CO2. And if any recent similar warming phase was natural then clearly the current phase of warming could also be a natural phenomena. If the current phase of warming could be natural then those arguing that it was primarily caused by human CO2 emissions would have to prove their hypothesis. And this is something they cannot do. The only “proof” that CO2 is currently forcing up global temperatures is the claim that the current warming is somehow unusual, unique and unnatural. That’s the total argument for CO2 forcing. Something unprecedented is happening to the climate and CO2 is the only candidate for what is causing this unique phenomena. Its certainly true that the well understood physics of CO2 in the atmosphere demonstrates (see “CO2 the basic facts“) that CO2 is indeed a greenhouse gas and will have a warming impact. No one disputes that. The issue is what is the scale of impact that this CO2 warming is having on the overall climate system. Is the effect of the CO2 so big that it can drive the temperature of the whole planet up in a way that is big enough to actually alter the climate? This is a much harder question to answer because no one has a model of the total climate system that actually works and which verifiably produces even remotely accurate forecasts about climate trends. So without a working model of the total climate system the only way to “prove” that CO2 is driving climate change is to prove that something truly unique is happening to the climate, that there is unprecedented warming occurring, and and then propose man made CO2 change as the only candidate as the cause of this ‘unprecedented’ warming.
The “problem” of the Medieval Warm Period Until the 1990s there were many, many references in scientific and historical literature to a period labelled the Medieval Warm Period (MWP) lasting from about AD 800–1300. It was followed by a much cooler period termed the Little Ice Age. Based on both temperature reconstructions using proxy measures and voluminous historical references it was accepted that the Medieval Warm Period had been a period when global temperatures were a bit hotter than today’s temperatures. Until about the mid-1990s the Medieval Warm Period was for climate researchers an undisputed fact. The existence of the Medieval Warm Period was accepted without question and noted in the first progress report of the IPCC from 1990. On page 202 of that 1990 IPCC report there was the graphic 7c (see below), in which the Medieval Warm Period was portrayed as clearly warmer than the present. By the time of the second IPCC report in 1995 where for the first time CO2 forcing began to be proposed more prominently as a cause of serious alarm, the Medieval Warm Period was sidelined in the text and narrative. An important way that this was done in the report was to alter the diagram of recent climate history by simply shortening the time period it covered so that it now started after the Medieval Warm Period. All that was shown was the long slow recovery from the Little Ice Age to today’s temperatures, i.e. a long period of increasing temperatures. But clearly this was only a short term solution. The way that the Medieval Warm Period dominated the recent climate graph challenged the basic argument for CO2 forcing which was that the late 20th century climate was some how unique. As Jay Overpeck, an IPCC participant said in his email to Professor Deming, “We have to get rid of the Medieval Warm Period”. In order to prove CO2 forcing the Medieval Warm Period had to be eliminated.
The Rise of the Hockey Stick Between the 1995 second IPCC report and the 2001 third IPCC report there was a complete revision in the way that recent climate history was portrayed. The supporters of the theory that CO2 changes were driving temperatures up had succeeded in their goal of eliminating the Medieval Warm Period. This rewriting of climate history and the elimination of the Medieval Warm Period was achieved through the famous Hockey Stick graph. To understand the scale of the revision that had taken place compare the two graphs below. The one on the left is diagram 7c from page 202 of the 1990 IPCC report in which the Medieval Warm Period was portrayed as clearly warmer than the present. On the right is the Hockey Stick graph from the 2001 IPCC report in which the Medieval Warm Period and the Little Ice Age have all but disappeared and the recent climate history is dominated by a rapid temperature rise in the last 20th century.
The first blow against the accepted understanding of climate history came in 1995 when the English climatologist Keith Briffa (based at the Climate Research Unit at East Anglia) published in the journal Nature a study with sensational results. According to his studies of tree rings in the Siberian Polar-Ural, there had never been a Medieval Warm Period and the 20th century suddenly appeared as the warmest of the last 1000 years. The most recent part of this study is known as the Yamal study, because of the name of the region it was done in, and it has recently been discredited – see here. Briffa’s work boldly proposed that the 20th Century had experienced the warmest climate of the millennium and this claim was now the central battlefield for the scientific argument about CO2 forcing. This of course ignored the Climatic Optimum (see Happy Holocene) between 5000 and 9000 years ago when temperatures were significantly higher than today but most people (and certainly the media and politicians) actually think that 5000 years is a long time ago so there was no need to undermine the Climatic Optimum in order to win wide public support for the CO2 forcing hypothesis. Hottest in the last 1000 years would do. Briffa’s work had an impact and laid the ground work but the real knock out blow that finally succeeded in eliminating the Medieval Warm Period was a paper published in 1998 in Nature by Mann, Bradley and Hughes entitled, “Global-scale temperature patterns and climate forcing over the past six centuries” (you can download it here). This was the original peer reviewed hockey stick article. Michael Mann of the Department of Geosciences, University of Massachusetts, who was the primary author of the paper, had in one scientific coup overturned the whole of climate history. Using tree rings as a basis for assessing past temperature changes back to the year 1,000 AD, supplemented by other proxies from more recent centuries, Mann completely redrew climate history, turning the Medieval Warm Period and Little Ice Age into non-events.In the new Hockey Stick diagram the Medieval Warm Period and Little Ice Age have disappeared, to be replaced by a largely benign and slightly cooling linear trend in climate until 1900 AD after which the Mann’s new graph showed the temperature shooting up in the 20th century in an apparently anomalous and accelerating fashion. In every other science when such a drastic revision of previously accepted knowledge is promulgated, there is considerable debate and initial scepticism, the new theory facing a gauntlet of criticism and intense review. Only if a new idea survives that process does it become broadly accepted by the scientific peer group and the public at large. This never happened with Mann’s `Hockey Stick’. The coup was total, bloodless, and swift as Mann’s paper was greeted with a chorus of uncritical approval from the increasingly politically committed supporters of the CO2 greenhouse theory. Within the space of only 12 months, the new theory had become entrenched as a new orthodoxy. The ultimate consummation of the new theory came with the release of the draft of the Third Assessment Report of the IPCC in 2000. Based solely on this new paper from a relatively unknown and young scientist the IPCC could now boldly state: “It is likely that the rate and duration of the warming of the 20th century is larger than any other time during the last 1,000 years. The 1990s are likely to have been the warmest decade of the millennium in the Northern Hemisphere, and 1998 is likely to have been the warmest year.” Overturning its own previous view in the 1995 report, the IPCC presented the `Hockey Stick’ as the new orthodoxy with hardly an apology or explanation for the abrupt U-turn since its 1995 report. The IPCC could show almost no supporting scientific justification because other than Mann’s Hockey Stick paper, and Briffa’s Siberian tree ring study there was little in the way of research confirming their new line. The Hockey Stick graph, the new orthodoxy, was blown up to a wall sized display and used as a back drop for the public launch of the 2001 IPCC report. Within months of the IPCC draft release, the long-awaited draft U.S. `National Assessment’ Overview document featured the `Hockey Stick’ as the first of many climatic graphs and charts in its report, affirming the crucial importance placed in it by the authors and by the active pro CO2 warming campaign at large. This was now not an esoteric theory about the distant past but rather the core foundation upon which the offensive on global warming was being mounted. Soon the Hockey Stick was everywhere and with it went the new simple and catchy campaigning slogans “its hotter now than the last 1000 years!“, “1998 was the hottest year for a 1000 years!” Not long after the 2001 IPCC report the Government of Canada sent the hockey stick to schools across the country, and its famous conclusion about the 1990s being the warmest decade of the millennium was the opening line of a pamphlet sent to every household in Canada to promote the Kyoto Protocol. Al Gore’s Oscar winning and hugely popular film “An Inconvenient Truth” was virtually built around the Hockey Stick (although Gore couldn’t resist tweaking it to make it look even more compelling by changing the way the graph data was displayed along the axis so that the temperature trend line it showed looked even steeper and starker). In the UK the Government announced that the DVD of the “An Inconvenient Truth” would be sent to every school in the country as a teaching aid. The Hockey Stick seemed to be carrying all before it. Dr Mann was promoted, given a central position in the IPCC and became a star of the media. And then it all went horribly wrong.
The Fall of the Hockey Stick In the years immediately after the 2001 IPCC report it seemed as if the sudden adoption of the Hockey Stick model of the earth’s recent climate past had created a new orthodoxy which could not be challenged. Even when some scientists quietly worried that the new theory about the past climate had been adopted way too quickly or were unhappy about the way that satellite temperature readings didn’t seem to fit the Hockey Stick model or they noticed that new individual proxy studies still seemed to keep showing that the Medieval Warm Period was hotter than today, they mostly stayed silent. They didn’t want to be branded as ‘deniers‘ after all. Then an unlikely hero emerged in the shape of Stephen McIntyre a retired mineralogist fromToronto. McIntyre is not a scientist or an economist but he does know a lot about statistics, maths and data analysis and he is a curious guy. He didn’t start off as a climate sceptic but was just someone interested in the nuts and bolts of these new and apparently exciting ideas about climate change, and he was curious about how the Hockey Stick graph was made and wanted to see if the raw data looked like hockey sticks too. In the Spring of 2003, Stephen McIntyre requested the raw data set used in the Hockey Stick paper from Mann. After some delay Mann arranged provision of a file which he said was the one used in the original 1998 Hockey Stick paper and McIntyre began to look at how Mann had processed all the data from the numerous different proxy studies cited as his source material and how they had been combined to produce the average that was the basis of the famous Hockey Stick shape. About this time Steve McIntyre linked up with Ross McKitrick a Canadian economist specialising in environmental economics and policy analysis. Together McIntyre and McKitrick began to dig down into the data that Mann had used in his paper and the statistical techniques used to create the single blended average used to make the Hockey Stick. They immediately began to find problems. Some of these problems just seemed the sort of errors that are caused by sloppy data handling concerning location labels, use of obsolete editions, unexplained truncations of available series, etc. Although such errors should have been spotted in the peer review process and they would adversely affect the quality of Mann’s conclusions they had a relatively small effect on the final results. But McIntyre and McKitrick found one major error, an error so big that it invalidated the entire conclusion of the whole paper. A whopper of an error. As we have seen what Mann had done was blend together lots of different proxy studies of the past climate going back a 1000 years and then produced an average of all these studies and a single graph showing the trend. Clearly the validity of the techniques used to blend together and average the different data from the various different studies was absolutely critical as to the validity of the final conclusions reached and the resulting Hockey Stick graph. This sort of blending of data sets is a very common statistical exercise and there are very well established techniques for undertaking such an exercise, these techniques use values that are called ‘principal components’ (if you want to know a lot more about the technical details then download McKitrick’s paper from here). What McIntyre and McKitrick discovered was that Mann had used very unusual principal component values and the effect of the choice of value used had drastically skewed the outcome of the blending and averaging exercise. Effectively what Mann’s odd statistical techniques did was to select data that had any sort of Hockey Stick shape and hugely increase its weight in the averaging process. Using Mann’s technique it meant that any data was almost certain to produce a spurious Hockey Stick shape. Here is an example of the sort of things Mann was doing to the raw date.
Above are two separate temperature reconstructions running from 1400AD, both use tree rings, one is from California and one is from Arizona. Both were were part of the data used by Mann and included in the Hockey Stick average. The top one shows a temperature up tick at the end in the 20th century like the final Hockey Stick, the other shows a relatively flat temperature for the 20th century. Mann’s statistical trick gives the top series, the one with the desired Hockey Stick shape a weighting in the data that is 390 times that of the bottom series just because it has a Hockey Stick bend at the end. This means that whatever data is fed into Mann’s statistical manipulations is almost bound to produce a Hockey Stick shape whether it is actually in the data or not. McIntyre and McKitrick then took their critical analysis a step further. When you apply a statistical manipulation to a set of data it is important to make sure that what you doing is not actually distorting the data so much that you are really just creating something new, spurious and false in the numbers. One way to do this is to take the statistical manipulation in question and apply it to several examples of random numbers (sometimes this is called a Red Noise test). To simplify, you use random numbers as input data, then apply the statistical technique you are testing to the random numbers then if the techniques are sound you should get a set of random numbers coming out the other end of the calculations. There should be no false shape imparted to the random noise by the statistical techniques themselves, if what you get out is random numbers then this would prove that the techniques you were testing were not adding anything artificial to the numbers. This is what McIntyre and McKitrick did using the techniques that Mann had used in the Hockey Stick paper. And the results were staggering. What they found was that 99% of the time you could process random data using Mann’s techniques and it would generate a Hockey Stick shape. This meant that Mann’s claim that the Hockey Stick graph represented an accurate reconstruction of the past climate was in tatters. Here are some examples. Below are eight graphs. Seven were made by processing random numbers using Mann’s techniques. The eighth is the actual Hockey Stick chart from Mann’s paper. See if you can spot which is which.
McIntyre and McKitrick submitted a letter to Nature about the serious flaws they had uncovered in the methodology used in the Hockey Stick paper. After a long (8-month) reviewing process Nature notified them that they would not publish it. They concluded it could not be explained in the 500-word limit they were prepared to give McIntyre and McKitrick, and one of the referees said he found the material was quite technical and unlikely to be of interest to the general readers! Instead of publishing anything from McIntyre and McKitrick explaining the serious errors that they had found Nature allowed Mann to make a coy correction in an on-line Supplement (but not in the printed text itself) where he revealed the nonstandard method he had used, and added the unsupported claim that it did not affect the results. Eventually in 2003, McIntyre and McKitrick published an article entitled “Corrections to the Mann et al. (1998) Proxy Data Base and Northern Hemisphere Average Temperature Series” in the journal Energy and Environment raising concerns about what they had found in Manns Hockey Stick paper. By this point following further work analysing Mann’s paper McIntyre and McKitrick showed that the data mining procedure did not just pull out a random group of proxies, instead it pulled out a single eccentric group of bristlecone pine chronologies published by Graybill and Idso in 1993 called the Sheep Mountain series.The original authors of the bristlecone study have always stressed that these trees are not proper climate proxies, their study was not trying to do a climate reconstruction and that they were surprised that Mann included it in the Hockey Stick data set. McIntyre and McKitrick had discovered that just removing this odd series from Mann’s proxy set and then applying Mann’s own eccentric statistical averaging caused the Hockey Stick shape to disappear. This revolutionary new model of the recent climate past was that fragile and it revealed the Hockey Stick graph as just a carefully worked artificial creation. In the graph below the dotted line is the original Hockey Stick chart as published by Mann and as adopted and promoted by the IPCC. The solid line shows the past temperature reconstruction if the data used by Mann is averaged using the correct statistical analysis techniques rather than Mann’s unconventional ones. As can be seen the familiar Medieval Warm Period re-emerges and the 1990s cease to be the hottest of the millennium, that title is now claimed by the early 1400s.
In doing this research McIntyre and McKitrick had legitimately accessed Mann’s public college web site server in order to get a lot of the source material, and whilst doing this they found the data that provoked them to look at the bristlecone series in a folder entitled “Censored”. It seems that Mann had done this very experiment himself and discovered that the climate graph loses its hockey stick shape when the bristlecone series are removed. In so doing he discovered that the hockey stick was not an accurate chart of the recent global climate pattern, it is an artificial creation that hinges on a flawed group of US proxies that are not even valid climate indicators. But Mann did not disclose this fatal weakness of his results, and it only came to light because of McIntyre and McKitrick’’s laborious efforts. You can download McKitrick’ss own account of the whole Hockey Stick saga here and this web page compiled by McIntyre and McKitrick has a list of links and documents relating to the Hockey Stick controversy. Following the publication of McIntyre and McKitrick’s critique of Mann’s work there was an immediate counter attack by some climatologists who had worked closely with Mann in the past. The attack on McIntyre and McKitrick’s critique of Mann’s work really boiled down to saying that of course the Hockey Stick disappeared if you stopped using Mann’s techniques and that you should carry on using Mann’s techniques and then you could get the Hockey Stick back! Eventually a US senate committee of inquiry was set up under the chairmanship of Edward Wegman a highly respected Professor of mathematics and statistics and in 2006 his report was published. You can download it here. The report examined the background to Mann’s Hockey Stick paper, the paper itself, the critique of it by McIntyre and McKitrick and took evidence from all the key players. Interestingly Wegman’s committee commissioned some original research into how the small world of climatology actually worked. The study of the social networking of the paleoclimatology world showed how closed it was and how often a small group of scientists both co-wrote and peer reviewed each others papers. For work that depended so much on making statistical claims about trends it was noted that it was surprising that no statisticians ever seemed to be involved in either the research work itself or its peer review. The key finding in the WEgman Report was that “Our committee believes that the assessments that the decade of the 1990s was the hottest decade in a millennium and that 1998 was the hottest year in a millennium cannot be supported by the MBH98/99 [the technical name of Mann's original Hockey Stick paper]” The other conclusions of the Wegman Report are also very interesting; It listed the following conclusions: Conclusion 1. The politicization of academic scholarly work leads to confusing public debates. Scholarly papers published in peer reviewed journals are considered the archival record of research. There is usually no requirement to archive supplemental material such as code and data. Consequently, the supplementary material for academic work is often poorly documented and archived and is not sufficiently robust to withstand intense public debate. In the present example there was too much reliance on peer review, which seemed not to be sufficiently independent. Conclusion 2. Sharing of research materials, data, and results is haphazard and often grudgingly done. We were especially struck by Dr. Mann’s insistence that the code he developed was his intellectual property and that he could legally hold it personally without disclosing it to peers. When code and data are not shared and methodology is not fully disclosed, peers do not have the ability to replicate the work and thus independent verification is impossible. Conclusion 3. As statisticians, we were struck by the isolation of communities such as the paleoclimate community that rely heavily on statistical methods, yet do not seem to be interacting with the mainstream statistical community. The public policy implications of this debate are financially staggering and yet apparently no independent statistical expertise was sought or used. Conclusion 4. While the paleoclimate reconstruction has gathered much publicity because it reinforces a policy agenda, it does not provide insight and understanding of the physical mechanisms of climate change except to the extent that tree ring, ice cores and such give physical evidence such as the prevalence of green-house gases. What is needed is deeper understanding of the physical mechanisms of climate change. Generally the response of the IPCC, the supporters of the CO2 hypothesis and the broader coalition of climate campaigners to all this was a cross between a sneer and a yawn, and the Hockey Stick continued to be used widely as a campaigning and propaganda tool. It is still being used today. In 2008 the BBC paid for a large truck to tour central London displaying a giant version of Mann’s Hockey Stick as part of the promotion of its very pro CO2 warming mini series called “Climate Wars”.
All temperature constructions have validated, not disproved, Mann's work. I'd trust more than two dozen academic reconstructions instead of a blogger's opinion piece.
Let me guess - all these guys are frauds, and "in" on the conspiracy? Wikipedia is probably "in" on it too, right?
Actually, since it was REALLY COLD this morning and some fish instantly froze to death near Norway, AGW can't be true. The polar bears haven't been inundated yet either. These guys are all frauds!
Mann, Bradley & Hughes 1998 "Global-scale temperature patterns and climate forcing over the past six centuries" Jones et al. 1998 "High-resolution palaeoclimatic records for the last millennium: interpretation, integration and comparison with General Circulation Model control-run temperatures". Pollack, Huang & Shen 1998 "Climate change record in subsurface temperatures: A global perspective". Mann, Bradley & Hughes 1999 "Northern hemisphere temperatures during the past millennium: Inferences, uncertainties, and limitations". Briffa 2000 "Annual climate variability in the Holocene: interpreting the message of ancient trees". Crowley & Lowery 2000 "How Warm Was the Medieval Warm Period?". Jones et al. (1998), calibrated by Jones, Osborn & Briffa 2001 "The Evolution of Climate Over the Last Millennium". Mann, Bradley & Hughes (1999) Briffa (2000), calibrated by Briffa, Osborn & Schweingruber 2004 "Large-scale temperature inferences from tree rings: a review". Crowley & Lowery 2000 "How Warm Was the Medieval Warm Period?". Briffa et al. 2001 "Low-frequency temperature variations from a northern tree ring density network". Esper, Cook & Schweingruber 2002 "Low-Frequency Signals in Long Tree-Ring Chronologies for Reconstructing Past Temperature Variability", recalibrated by Cook, Esper & D'Arrigo 2004 "Extra-tropical Northern Hemisphere land temperature variability over the past 1000 years". Mann & Jones 2003 "Global surface temperatures over the past two millennia." Pollack & Smerdon 2004 "Borehole climate reconstructions: Spatial structure and hemispheric averages". Oerlemans 2005 "Extracting a climate signal from 169 glacier records". Rutherford et al. 2005 "Proxy-based Northern Hemisphere surface temperature reconstructions: Sensitivity to method, predictor network, target season, and target domain". Moberg et al. 2005 "Highly variable Northern Hemisphere temperatures reconstructed from low- and high-resolution proxy data". D'Arrigo, Wilson & Jacoby 2006 "On the long-term context for late twentieth century warming". Osborn & Briffa 2006 "The spatial extent of 20th-century warmth in the context of the past 1200 years". Hegerl et al. 2006 "Climate sensitivity constrained by temperature reconstructions over the past seven centuries". Smith et al. 2006 "Reconstructing hemispheric-scale climates from multiple stalagmite records". Juckes et al. 2007 "Millennial temperature reconstruction intercomparison and evaluation". Lee, Zwiers & Tsao 2008 "Evaluation of proxy-based millennial reconstruction methods". Huang, Pollack & Shen 2008 "A late Quaternary climate reconstruction based on borehole heat flux data, borehole temperature data, and the instrumental record" Mann et al. 2008 "Proxy-based reconstructions of hemispheric and global surface temperature variations over the past two millennia" Kaufman et al. 2009 "Recent warming reverses long-term arctic cooling". Tingley & Huybers 2010a "A Bayesian Algorithm for Reconstructing Climate Anomalies in Space and Time". Ljungqvist 2010 "A New Reconstruction of Temperature Variability in the Extra-Tropical Northern Hemisphere During the Last Two Millennia". Christiansen & Ljungqvist 2011 "Reconstruction of the Extratropical NH Mean Temperature over the Last Millennium with a Method that Preserves Low-Frequency Variability". Ljungqvist et al. 2012 "Northern Hemisphere temperature patterns in the last 12 centuries". Christiansen & Ljungqvist 2012 "The extra-tropical Northern Hemisphere temperature in the last two millennia: Reconstructions of low-frequency variability". Marcott et al. 2013 "A Reconstruction of Regional and Global Temperature for the Past 11,300 Years" Ahmed et al. 2013 (PAGES 2k Consortium) "Continental-scale temperature variability during the past two millennia"
[This message has been edited by masospaghetti (edited 01-22-2014).]
Back in 1998, a little known climate scientist named Michael Mann and two colleagues published a paper that sought to reconstruct the planet's past temperatures going back half a millennium before the era of thermometers--thereby showing just how out of whack recent warming has been. The finding: Recent northern hemisphere temperatures had been "warmer than any other year since (at least) AD 1400." The graph depicting this result looked rather like a hockey stick: After a long period of relatively minor temperature variations (the "shaft"), it showed a sharp mercury upswing during the last century or so ("the blade").
The report moved quickly through climate science circles. Mann and a colleague soon lengthened the shaft of the hockey stick back to the year 1000 AD--and then, in 2001, the UN's Intergovernmental Panel on Climate Changeprominently featured the hockey stick in its Third Assessment Report. Based on this evidence, the IPCC proclaimed that "the increase in temperature in the 20th century is likely to have been the largest of any century during the past 1,000 years."="#fig220">
And then all hell broke loose.
Mann tells the full story of the hockey stick--and the myriad unsuccessful attacks on it--in his 2012 book TheHockey Stick and the Climate Wars: Dispatches from the Front Lines; Mann will appear at a Climate Desk Live event on May 15 to discuss this saga. But to summarize a very complex history of scientific and political skirmishes in a few paragraphs:
The hockey stick was repeatedly attacked, and so was Mann himself. Congress got involved, with demands for Mann's data and other information, including a computer code used in his research. Then the National Academy of Sciences weighed in in 2006, vindicating the hockey stick as good science and noting:
"The basic conclusion of Mann et al. (1998, 1999) was that the late 20th century warmth in the Northern Hemisphere was unprecedented during at least the last 1,000 years. This conclusion has subsequently been supported by an array of evidence that includes both additional large-scale surface temperature reconstructions and pronounced changes in a variety of local proxy indicators, such as melting on ice caps and the retreat of glaciers around the world."
It didn't change the minds of the deniers, though--and soon Mann and his colleagues were drawn into the 2009 "Climategate" pseudo-scandal, which purported to reveal internal emails that (among other things) seemingly undermined the hockey stick. Only, they didn't.
In the meantime, those wacky scientists kept doing what they do best--finding out what's true. As Mann relates, over the years other researchers were able to test his work using "more extensive datasets, and more sophisticated methods. And the bottom line conclusion doesn't change." Thus the single hockey stick gradually became what Mann calls a "hockey team." "If you look at all the different groups, there are literally about two dozen" hockey sticks now, he says.
Chris Mooney May 10 2013, 11:34 AM ET 0 inShare More IPCC_2001_TAR_Figure_2-CD.jpg
IPCC Third Assessment Report/Wikipedia
Back in 1998, a little known climate scientist named Michael Mann and two colleagues published a paper that sought to reconstruct the planet's past temperatures going back half a millennium before the era of thermometers--thereby showing just how out of whack recent warming has been. The finding: Recent northern hemisphere temperatures had been "warmer than any other year since (at least) AD 1400." The graph depicting this result looked rather like a hockey stick: After a long period of relatively minor temperature variations (the "shaft"), it showed a sharp mercury upswing during the last century or so ("the blade").
The report moved quickly through climate science circles. Mann and a colleague soon lengthened the shaft of the hockey stick back to the year 1000 AD--and then, in 2001, the UN's Intergovernmental Panel on Climate Changeprominently featured the hockey stick in its Third Assessment Report. Based on this evidence, the IPCC proclaimed that "the increase in temperature in the 20th century is likely to have been the largest of any century during the past 1,000 years."="#fig220">
And then all hell broke loose.
Mann tells the full story of the hockey stick--and the myriad unsuccessful attacks on it--in his 2012 book TheHockey Stick and the Climate Wars: Dispatches from the Front Lines; Mann will appear at a Climate Desk Live event on May 15 to discuss this saga. But to summarize a very complex history of scientific and political skirmishes in a few paragraphs:
The hockey stick was repeatedly attacked, and so was Mann himself. Congress got involved, with demands for Mann's data and other information, including a computer code used in his research. Then the National Academy of Sciences weighed in in 2006, vindicating the hockey stick as good science and noting:
"The basic conclusion of Mann et al. (1998, 1999) was that the late 20th century warmth in the Northern Hemisphere was unprecedented during at least the last 1,000 years. This conclusion has subsequently been supported by an array of evidence that includes both additional large-scale surface temperature reconstructions and pronounced changes in a variety of local proxy indicators, such as melting on ice caps and the retreat of glaciers around the world."
It didn't change the minds of the deniers, though--and soon Mann and his colleagues were drawn into the 2009 "Climategate" pseudo-scandal, which purported to reveal internal emails that (among other things) seemingly undermined the hockey stick. Only, they didn't.
In the meantime, those wacky scientists kept doing what they do best--finding out what's true. As Mann relates, over the years other researchers were able to test his work using "more extensive datasets, and more sophisticated methods. And the bottom line conclusion doesn't change." Thus the single hockey stick gradually became what Mann calls a "hockey team." "If you look at all the different groups, there are literally about two dozen" hockey sticks now, he says.
Mother Jones' Jaeah Lee traced the strange evolution of the hockey stick story in this video:
Indeed, two just-published studies support the hockey stick more powerfully than ever. One, just out in Nature Geoscience, featuring more than 80 authors, showed with extensive global data on past temperatures that the hockey stick's shaft seems to extend back reliably for at least 1,400 years. Recently in Science, meanwhile, Shaun Marcott of Oregon State University and his colleagues extended the original hockey stick shaft back 11,000 years. "There's now at least tentative evidence that the warming is unprecedented over the entire period of the Holocene, the entire period since the last ice age," says Mann.="#author-information">
So what does it all mean? Well, here's the millennial scale irony: Climate deniers threw everything they had at the hockey stick. They focused immense resources on what they thought was the Achilles Heel of global warming research--and even then, they couldn't hobble it. (Though they certainly sowed plenty of doubt in the mind of the public.)
What's more, even if they'd succeeded, in a scientific sense it wouldn't have even mattered.
"Climate deniers like to make it seem like the entire weight of evidence for climate change rests on the hockey stick," explains Mann. "And that's not the case. We could get rid of all these reconstructions, and we could still know that climate change is a threat, and that we're causing it." The basic case for global warming caused by humans rests on basic physics--and, basic thermometer readings from around the globe. The hockey stick, in contrast, is the result of a field of research called paleoclimatology (the study of past climates) that, while fascinating, only provides one thread of evidence among many for what we're doing to the planet.
Meanwhile, the hockey stick's blade doesn't just stop rising of its own accord. It's just going to go up, and up, and up, as the image above, combining the Marcott hockey stick with projections of where temperatures are headed by 2100, plainly shows.
When he shows that graph to audiences, says Mann, "I often hear an audible gasp." In this sense, the hockey stick does indeed matter--for it dramatizes just how much human irresponsibility, in a relatively short period of time, can devastate the only home we have.
While I give full credit to the guys with the long explanations, the data is self explanatory.
By simply looking you can see the spikes in 1998 and 2010, and you can see the lesser spike in 2012 followed by decline.
By running the posted numbers you still get the historical data which shows the North American continent had cooling from 1880 to 1920, warming from 1921 to 1959, cooling from 1960 to 1979 and back to warming from 1980 to1998. We know now from NASA that they cannot explain the lack of warming form 1998 forward.
A simple calculation by compiling the various decade figures shows there is a net cooling from 1880 to today of about .14 degrees.
People are doing proverbial back flips trying to prop up Mann's fraudulent assertions. Look outside. Does this look like Global Warming? Look at the Glaciers, the Antarctic ice pack, and the Arctic ice field which did not disappear on schedule.
Sure the climate changes, every year, every day. Is the Global Warming theory correct? nope......
Originally posted by Arns85GT: Look outside. Does this look like Global Warming? Look at the Glaciers, the Antarctic ice pack, and the Arctic ice field which did not disappear on schedule... Is the Global Warming theory correct? nope......
Those scientists are so dumb. All they needed to do is look outside!
LOL I've got -15 Celcius on my front porch right now. Talk about wanting warming?
But remember seriously,
By simply looking at the graph you can see the spikes in 1998 and 2010, and you can see the lesser spike in 2012 followed by decline.
By running the posted numbers you still get the historical data which shows the North American continent had cooling from 1880 to 1920, warming from 1921 to 1959, cooling from 1960 to 1979 and back to warming from 1980 to1998. We know now from NASA that they cannot explain the lack of warming form 1998 forward.
A simple calculation by compiling the various decade figures shows there is a net cooling from 1880 to today of about .14 degrees.
By simply looking at the graph you can see the spikes in 1998 and 2010, and you can see the lesser spike in 2012 followed by decline.
You say it's simple. I've previously challenged you to have someone competent do a simple least-squares fit to that data, and the let us know the results. Have you started that yet?
quote
A simple calculation by compiling the various decade figures shows there is a net cooling from 1880 to today of about .14 degrees.
If it's that simple, why don't you write a paper and submit it to one of the peer-reviewed scientific journals? Since it's simple, your paper probably wouldn't have to be very long. Before doing so, however, I suggest that you carefully review the accepted definitions of "climate" vs. "weather" and "global" vs. "regional," and it probably would help if you would brush up on your proficiency in math and statistics.
[This message has been edited by Marvin McInnis (edited 01-23-2014).]
You know it doesn't work that way in the real world, Arn. It is your assertion that the widely accepted scientific analysis is wrong (or corrupt), so it's your responsibility to substantiate your position. Refusing to do so effectively negates your assertion. "It's obvious! Just look!" may work for magicians and charlatans, but it doesn't cut it in scientific discourse.
[This message has been edited by Marvin McInnis (edited 01-23-2014).]
You know it doesn't work that way, Arn. It is your assertion that the widely accepted scientific analysis is wrong (or corrupt), so it's your responsibility to substantiate your position. Refusing to do so effectively negates your assertion. "It's obvious! Just look!" doesn't cut it in scientific discourse.
You would think if it was so easy to disprove he'd jump at the opportunity. I wonder what's holding him back? I have even supplied him with email addresses to send his findings.
I don't have to prove a thing. It is already done with peer reviewed reports filed with IPCC and NASA which you can read here
31,487 scientists have submitted argument including
3,805 scientists trained in specialties directly related to the physical environment of the Earth and the past and current phenomena that affect that environment.
5,812 scientists trained in the fundamental physical and molecular properties of gases, liquids, and solids, which are essential to understanding the physical properties of the atmosphere and Earth.
4,822 scientists trained in the molecular interactions and behaviors of the substances of which the atmosphere and Earth are composed.
2,965 scientists trained in the functional and environmental requirements of living things on the Earth.
It is already done with peer reviewed reports filed with IPCC and NASA which you can read here
The paper you cite appears to have been published in the Journal of American Physicians and Surgeons, but neither "peer reviewed" nor "filed with IPCC and NASA." (Note that the file you linked is named "Draft_208.pdf," though, which may raise questions about whether this version is the one actually published. Regardless, it seems highly unlikely that it was ever submitted to peer review.) Did you actually read it? Did you understand any of it? In a nutshell, it argues that:
The global (and North American) climate has been warming rapidly since around 1800; global sea level is currently rising at ~7 inches per century; glaciers have been retreating globally since ~1850; air temperatures are increasing both at the surface and in the troposphere
Carbon dioxide levels have also been rising over the past two centuries, primarily due to human activity.
Carbon dioxide is not responsible for any of the observed warming.
Increased carbon dioxide is good for us, in any event, because it promotes plant growth.
One might reasonably wonder what an article on climate change is doing in a medical journal. My first thought would be, "Probably because they couldn't get it published anywhere else." A little investigation reveals that the Association of American Physicians and Surgeons is an ultra-conservative organization (nothing inherently wrong with that) and that their Journal almost exclusively publishes articles with a strong libertarian/conservative political viewpoint. (e.g. Autism is actually caused by the thimerosol [mercury] preservative in childhood vaccines; opposing immigration; opposing gun regulation; opposing vaccination as a "tool of the state"; claiming that "shaken baby syndrome" is actually a misdiagnosis for vaccine-induced encephalitis; HIV is not the cause of AIDS; abortion causes breast cancer; derogating the peer-review process itself; considers the FDA to be unconstitutional and describes public health programs as "tyranny"; etc.) It appears that climatology is not the only science that the Journal of American Physicians and Surgeons chooses to deny. Perhaps most telling, the U.S. National Library of Medicine at the National Institutes of Health has declined to include the Journal of American Physicians and Surgeons with the ~5,000 medical journals indexed in its MEDLINE and PubMed databases.
Edit: Here is a link to the version of the paper actually published. I haven't done (and don't plan to do) a detailed comparison of this version vs. the draft version Arn cited.
quote
31,487 scientists have submitted argument including [sic] ... You can see the full list here
No. The claim is that 31,487 scientists have signed a petition ... of which, by the organizers' own accounting, a grand total of 39 identify climatology as their primary area of expertise.
quote
Oh, by the way, the Polar Vortex doesn't exist either ...
Besides you, the only person I've heard making that claim recently is Rush Limbaugh ... who is an entertainer, not a meteorologist or climatologist.
[This message has been edited by Marvin McInnis (edited 01-24-2014).]
I don't think they should all be dismissed by their lessers.
It does not take a television personality to observe the effects of a polar vortex. It takes only a casual observation to conclude that the protestations of the AGW proponents of global disaster, inundated islands, millions of climate refugees, increased hurricane activity, and an open Arctic Ocean are simply errant and false.
These scientists and scholars had the moxy to resist the false claims of politicians and their paid lackies and they should be commended not discounted and criticized or called non-credible. What high handed nonesense.
Criticize me if you like, but I am not your problem. Your problem is that the facts do not support AGW.
The paper submitted with the petition was given to every signer in advance before they signed on.
"Given to" every signer in advance? "Made available to," maybe. Potential signatories have to download it themselves for review.
More interestingly, I had failed to note earlier that two of the three authors of the paper ... both PhD chemists ... are the very same persons responsible for circulating the petition. Recursive references. Conflict of interest, maybe?
For reference, here is what the petition actually says:
"We urge the United States government to reject the global warming agreement that was written in Kyoto, Japan in December, 1997, and any other similar proposals. The proposed limits on greenhouse gases would harm the environment, hinder the advance of science and technology, and damage the health and welfare of mankind.
"There is no convincing scientific evidence that human release of carbon dioxide, methane, or other greenhouse gases is causing or will, in the foreseeable future, cause catastrophic heating of the Earth’s atmosphere and disruption of the Earth’s climate. Moreover, there is substantial scientific evidence that increases in atmospheric carbon dioxide produce many beneficial effects upon the natural plant and animal environments of the Earth."
So ... the purpose of the petition is 100% political, to defeat U.S. ratification of the Kyoto Protocol (and help the fossil fuel industry immensely). The rest is just rhetoric.
quote
I don't think they should all be dismissed by their lessers.
Insult duly noted and shrugged off. This isn't the first time that you've disparaged the credentials of people here who disagree with your opinion. In response, two months ago I challenged you to produce your own technical credentials for us to see. We're still waiting ... but the quality of your posts speaks volumes, and much of it is so naive as to be truly embarrassing.
[This message has been edited by Marvin McInnis (edited 01-24-2014).]
Now how about the other 30,000 papers published in 2013 that conclude the exact opposite?
Wow! Can you get a list with links that shows all of these? You know, I want to add them up to see if there are really 30,000 papers and not just one that has been circulated 30,000 times.
Insult duly noted and shrugged off. This isn't the first time that you've disparaged the credentials of people here who disagree with your opinion. In response, two months ago I challenged you to produce your own technical credentials for us to see. We're still waiting ... but the quality of your posts speaks volumes, and much of it is so naive as to be truly embarrassing.
So you are going to prove that the protestations of the AGW proponents of global disaster, inundated islands, millions of climate refugees, increased hurricane activity, and an open Arctic Ocean are not false and misleading?
If so, what are your qualifications to say that any of these forecasted disasters have occurred?
What are your qualifications to say that the Arctic ice field completely melted any time in the last century?
What are your qualifications to say that the IPCC charts and graphs claiming AGW is happening are true?
You are the only one I've seen around here repeatedly demanding to see "qualifications" in order to discredit someone. I just challenged you to provide your own first, that's all.
You are the only one I've seen around here repeatedly demanding to see "qualifications" in order to discredit someone. I just challenged you to provide your own first, that's all.
Wrong. FlyinFieros does it frequently, while ignoring the actual content, which is a misdirection. Arn has a legitimate question.
As late as this month, Forbes Magazine has pointed out the difficulty IPCC has with explaining away the greatly expanded Polar Vortex IPCC report. They say
Confronted with the embarrassment of historic cold gripping the nation just as the Obama administration launches a new offensive on the mythical global warming crisis, global warming activists and their media allies just invented their most knee-slapping assertion yet; that global warming causes winter cold outbreaks. Global warming activists, after giving us about 48 hours of silence after the cold temperatures hit while they scrambled to come up with an explanation, now say they have always predicted that global warming would cause more frequent and severe winter cold spells.
It is quite amusing how the global warming propaganda machine works. For about 24 hours after the cold temperatures descended, the alarmists were enforcing radio silence on global warming. Then, when the global warming jokes were too widespread to ignore, they spent the next 24 hours telling us that occasional cold outbreaks are still “consistent” with a rapidly warming planet. Another 24 hours later, they morphed into the “we predicted this all along” meme.
Here are some of the latest headlines along that narrative:
“How frigid ‘polar vortex’ could be result of global warming” – Christian Science Monitor
“Polar Vortex: Climate Change Could Be the Cause of Record Cold” – Time
“US polar vortex may be example of global warming” – The Guardian
“Thank Global Warming for Freezing You Right Now” – The Daily Beast
“Cold as Hell: The Chilling Effect of Global Warming” – Huffington Post
In other words, thinking people are seeing through the Global Warming/Climate Change rhetoric and asking much deserved questions about the credibility of exaggerated prognostications that continually ratchet downward.
Arn
A couple of biased articles doesn't trump the science Arn, seriously Forbes' James Taylor??? As for the Daily Tech one it actually looks pretty close the the 2001 prediction.
Oh and be sure to Answer Marvins Question when you have a moment.
I'll be interested how the 2001 IPCC prediction does down the line which new data comes to light (perhaps over the next 10 years). How come the 2001 prediction is closer to the data than the 2007?
or....did they just use simple linear trendlines as their prediction models?
If you look at an analysis of the temperature data, their linear prediction do follow the data (I've shown a couple of actual data based linear predictions below that closely match the IPCC predictions), but, if you move to a simple second order polynomial prediction, you can see that the data follows slight decline, which is a lot closer to that actual data. So....let's watch for the next few years to see where the data goes...
I don't think small sample linear predictions are very representative, in fact, definitely misleading. I also still say a trend analysis of temperature data using a lot longer sample (say the last 50+ million years) is much more predictive allowing a true comparison of where we are with what would be expected.