There are several papers that present evidence tha cloud feedbacks are not positive, but possible negative. Yet another warmists assumption and climate model assumption that may be incorrect.
On the Misdiagnosis of Surface Temperature Feedbacks from Variations in Earth’s Radiant Energy BalanceJuly 25, 2011, Remote Sensing – by Roy W. Spencer and William D. Braswell
Simple Climate Model in Excel, Version 1.0 April 26, 2010 – by Roy W. Spencer
Potential Biases in Feedback Diagnosis from Observational Data: A Simple Model Demonstration (PDF) November 1, 2008, Journal of Climate – by Roy W. Spencer & William D. Braswell
Satellite and Model Evidence Against Substantial Manmade Climate Change (this article supercedes “Has the Climate Sensitivity Holy Grail Been Found?”) December 27, 2008 – by Roy W. Spencer, Ph. D.
Global Warming as a Natural Response to Cloud Changes Associated with the Pacific Decadal Oscillation (PDO) October 20, 2008 (updated December 29, 2008) – by Roy W. Spencer, Ph. D.
Cloud and Radiation Budget Changes Associated with Tropical Intraseasonal Oscillations (PDF) August 9, 2007, Geophysical Research Letters – by Roy W. Spencer, William D. Braswell, John R. Christy, and Justin Hnilo
You only say that to be insulting, and think that wins you the debate. You are intellectually lazy.
I say that because no matter how obvious it is, you don't get it.
quote
Originally posted by fierobear:
LOL global warming. And the morons who unquestionably STILL believe it!
quote
Originally posted by masospaghetti:
Just like the morons who unquestionably REFUSE to believe it!
Do you not see it? Do you not see how ANYONE who unquestionably believes either position is a fool? I couldn't care less about "winning the debate", but I do like exposing your double standards.
[This message has been edited by masospaghetti (edited 08-27-2013).]
Do you not see it? Do you not see how ANYONE who unquestionably believes either position is a fool? I couldn't care less about "winning the debate", but I do like exposing your double standards.
That doesn't mean I am wrong or being hypocritical. It does mean we AGREE on the major point.
Source : Wikipedia Because I didn't need a graph that showed 100,000s of years. Just one that covered the same time period as the graph above.
This was pointed out to me by friends outside of PFF. and the question is how do these 2 graphs show a connection between human released co2 and rising temperatures....
[This message has been edited by jmclemore (edited 09-01-2013).]
Originally posted by jmclemore: This was pointed out to me by friends outside of PFF. and the question is how do these 2 graphs show a connection between human released co2 and rising temperatures....
While there is no universal definition of a heat wave, this indicator defines a heat wave as a four-day period with an average temperature that would only be expected to occur once every 10 years, based on the historical record . . . This index tracks the frequency of heat waves across the lower 48 states, but not the intensity of these episodes . . . The index value for a given year could mean several different things. For example, an index value of 0.2 in any given year could mean that 20 percent of the recording stations experienced one heat wave; 10 percent of stations experienced two heat waves; or some other combination of stations and episodes resulted in this value.
Four day period? Once every 10 years? Frequency, but not intensity? This U.S. Heat Wave Index seems oddly contrived, and not something that has been derived from raw temperature data using a straightforward, scientifically understandable method. And in the context of discerning a GLOBAL warming signal, it only represents the 48 contiguous U.S. states--not nearly enough data.
So I wouldn't make too much of this U.S. Heat Wave Index in the context of global warming, just as I wouldn't check if the whole turkey was thoroughly roasted by plucking out and testing just one of the wings.
The GISS reports, which are frequently updated, include data from the entire planet, which is crucial for confirming the spatial signature of a MMGW (man made global warming) driven by human greenhouse gas emissions: the science predicts that the temperature increases will be larger in the Northern Hemisphere than the Southern Hemisphere; larger near the polar regions than near the equator; and larger over land masses than across the surfaces of the oceans.
he GISS reports, which are frequently updated, include data from the entire planet, which is crucial for confirming the spatial signature of a MMGW (man made global warming) driven by human greenhouse gas emissions: the science predicts that the temperature increases will be larger in the Northern Hemisphere than the Southern Hemisphere; larger near the polar regions than near the equator; and larger over land masses than across the surfaces of the oceans.
Except they can't seem to find the heating over land, so they moved their theory to the deep oceans.
I wonder where they will search for the mysterious and slippery missing heat next?!?
Like most of the charts I see these use only data from the 1970's forward. . . . . This Chart (below) is flawed : Disproportionately tracks data ranges to create the appearance of rising temperatures. it's an example of a deceptive chart. Range 1850 - 1909 : the chart shows only data for 1875. (range covers 59 years) Range 1910 - 1929 : No data is represented. (range covers 19 years) Range 1930 - 1949 : only 6 measurements are included. (range covers 19 years) Range 1950 - 1969 : 10 data points used. (range covers 19 years) Range 1970 - 1989 : 12 data points were used. (range covers 19 years) Range 1990 - 1999 : 10 data points used. (range covers 9 years) Range 2000 - 2010 : 12 data points used. (range covers 10 years) (the chart was posted on the source site as a bad attempt to manipulated data) . . . . Earlier Post on this Topic Remove the Added green line and you'll notice several things.
The time frames between 1920-1940 and 1980 - 2000 look a lot a like
The data ranges are limited to 1900 - 2000.
The graph shows temperatures cooling
And evidently their crystal ball can see 30 yrs into the future after the green line lost it's bearing.
Earlier Post on this Topic Another chart with limited range and no defined data points. However it looks like someone tried to represent a pattern of data points at the end of the range.
mathematically, If you control the ranges and the number of data points used to represent your point, you can make it say anything you want.
. . . More data is the right way to see changes in context. The problem I have with the above chart is that while it appears to have more data by representing 126 years, it only uses 1 data point per year. So a period of 10 years, some how, is reduced to 1 data point. But, thats not the only problem. If the data point is based on the high temps of that year and nothing else, it's bad utilization of the data. If it is an average of the daily temperatures for that year then at least the it's considering all of the data.
Remember more data not less......
Both side have been caught using modified, manipulated, cheery picked and even Ass PulledClick to show data. The best way to see a trend is to look at the whole picture without narrowing the data to 1 spectrum or cramming in additional data to cloud reality.
There is a saying, If you can't Dazzle them with Brilliance Baffle them with BS. so despite the IPCC and others reporting higher temperatures related to human release co2 are having an effect on the arctic ice fields You eventually come across statements like this. Source
quote
Earth's axial tilt or obliquity varies from 24.5 degrees to 22.1 degrees over the course of a 41,000-year cycle. The current angle is 23.4 degrees. Changes in axial tilt affect the distribution of solar radiation received at the earth's surface. When the angle of tilt is low, polar regions receive less insulation. When the tilt is greater, the polar regions receive more insulation during the course of a year. Like precession and eccentricity, changes in tilt thus influence the relative strength of the seasons, but the effects of the tilt cycle are particularly pronounced in the high latitudes where the great ice ages began.
There is no way that statement from noaa can be miss understood. They clearly say the tilt effects the ice caps and global temperatures.
I see a relationship and it's looking less like human released co2 is causing global warming trends. The direction of my reading is now looking at the function of co2 in our atmosphere in regards to
CO2's weight and density.
CO2's effect on precipitation.
CO2's ability to reflect incoming and outbound radiation.
I realize you guys have likely covered it already but I have decided in agreement with others that finding the information yourself is the best way to make up your mind. It's beats just nodding in agreement.
[This message has been edited by jmclemore (edited 09-02-2013).]
Earth's axial tilt or obliquity varies from 24.5 degrees to 22.1 degrees over the course of a 41,000-year cycle. The current angle is 23.4 degrees. Changes in axial tilt affect the distribution of solar radiation received at the earth's surface. When the angle of tilt is low, polar regions receive less insulation. When the tilt is greater, the polar regions receive more insulation during the course of a year. Like precession and eccentricity, changes in tilt thus influence the relative strength of the seasons, but the effects of the tilt cycle are particularly pronounced in the high latitudes where the great ice ages began.
I am skeptical of jmclemore's skepticism about the accuracy of MMGW (man made global warming).
That's a reference to a 41,000 year cycle, which takes 20,500 years to move from one extreme to the other.
I don't have the mastery of the subject matter and the requisite mathematical "chops" to personally debunk this, but it seems unlikely to me (a priori) that these 41,000 year cycles based on the earth's axial tilt could account for the measurements (including polar temperatures and ice coverage) that so many scientists are describing as indicators of a "rapid" global warming:
quote
Some experts point out that natural cycles in Earth's orbit can alter the planet's exposure to sunlight, which may explain the current trend. Earth has indeed experienced warming and cooling cycles roughly every hundred thousand years due to these orbital shifts, but such changes have occurred over the span of several centuries. Today's changes have taken place over the past hundred years or less.
I am skeptical of jmclemore's skepticism about the accuracy of MMGW (man made global warming).
I agree that human release of GHG's such as CO2 do occur. I agree that GHG are measurable and CO2 levels have increased. I agree that many of the graphs used show an increase in global temperatures in the atmosphere, on land and in the ocean.
I am skeptical of whether or not GHG gases are causing temperature changes. I am skeptical of graphs posted in a discussion where the data can not be verified. (I'd rather see the temperatures and other climate events listed by date over a period of time) I am skeptical when data is explained away so it does not have to be included.
Some of the excuses that make me doubt a claim.
Natural Sources of GHG are not part of the problem (?) Climate Change is not happening (?) The Science is settled (?) Solar Activity has little to do with global climate change (?) All the Climate models are biased (?) Global Temperature Variation is irrelevant to current temperatures (?)
So you don't have to be skeptical I am in fact Skeptical of several issues on both side.
Questions some of you might have an answer for. Anyone feel like explaining how Carbon Dioxide migrates from the emission source up into the atmosphere. ( weight ? )
In the atmosphere, what is the concentration levels in each layer. ( how high is the co2 migrating through our atmosphere )
Originally posted by jmclemore: In the atmosphere, what is the concentration levels in each layer. ( how high is the co2 migrating through our atmosphere )
The survey says..
quote
CO2 concentrations aren’t the same everywhere. In general, CO2 is well mixed in the atmosphere, mainly because it’s so long lived. Individual CO2 molecules do cycle back and forth in annually balanced exchanges between the atmosphere, biosphere, and oceans. However, the net addition of CO2 to the atmosphere from human activities will take a very long time to be permanently absorbed by oceans, plants, and soil. If you add a pulse of extra CO2 into the atmosphere, only about half of it will be gone from the air a century later. The rest will leave the atmosphere even more gradually, over hundreds and even thousands of years.
Since CO2 has plenty of time to disperse throughout the global atmosphere, it’s possible to use values collected at a remote site like Mauna Loa—more than two miles above the Pacific, and many hundreds of miles from any continent—as a proxy for global concentrations.
Even so, there are significant differences from place to place and one time to another, as vividly illustrated by NOAA’s CarbonTracker website. CO2 is regularly measured at several other locations, such as Australia's Cape Grim and Ireland's Mace Head. A major NCAR-led field project called HIPPO sampled the atmosphere between the Arctic and Antarctic on five occasions from 2009 to 2012, measuring seasonal and latitudinal variations in CO2 from aboard HIAPER, the NSF/NCAR Gulfstream V aircraft. Researchers are now using that wealth of data to gain a better picture of how CO2 amounts vary within the long-term global increase.
As far as how CO2 varies with altitude as you go up through the atmosphere from surface level to the stratosphere:
About all I could "get" is that as you go higher in the atmosphere, it becomes more evenly distributed around the world than it is at ground level, where it enters the atmosphere as highly localized, concentrated plumes from human installations and areas of dense vehicle traffic; but it thins out some (perhaps a lot) at the higher altitudes.
The altitude dependent characteristics of CO2 are actively being researched using satellite data, and as the results become usable (example: ACE-FTS CO2 profile database) it would seem like a logical development for this kind of data to be incorporated into the various Global Climate Model computer programs.
[This message has been edited by rinselberg (edited 09-03-2013).]
Henson has done allot of research and he baffles you with detail, while skating over the central point.
He states "Scientists had known for decades that global increases in CO2 could theoretically warm the atmosphere" but notice the word "theoretically"
You can theorize things that just don't happen due to practical science. But his biggest error is believing that CO2 is a causal agent for Global Warming. It is not causal, but is an effect.
The practical science is that the CO2 percentage of the atmosphere is 0.039% Even if it doubles it is still less than 1%. If it was causal, it would face a severe uphill climb to buck against 97% water vapour and clouds, and even if you take the combined effect of CO2,Ozone, CH4, and N2O you are still just at 3% with all combined.
Also, he says "Since CO2 has plenty of time to disperse throughout the global atmosphere, it’s possible to use values collected at a remote site like Mauna Loa" while oblivious to the fact that the NASA satellite tracking shows the concentrations of greenhouse gases to be very splotchy in the atmosphere and not at all homogenous.
In short, you can flood the conversation with CO2 studies and facts, but it does not change the basic science. Look at it this way
The practical science is that the CO2 percentage of the atmosphere is 0.039% Even if it doubles it is still less than 1%. If it was causal, it would face a severe uphill climb to buck against 97% water vapour and clouds, and even if you take the combined effect of CO2,Ozone, CH4, and N2O you are still just at 3% with all combined.
We can debate CO2 all we want. The bottom line is that CO2 alone is not capable of driving any significant changes to the climate at the scales we are currently dealing with. An increase from 300ppm to 400ppm won't cause the disasters they claim.
Climate sensitivity must be high. So far, climate sensitivity is proving to be fairly low.
Feedbacks in the climate system must occur. The increased CO2 must cause other things to happen to hold the additional heat necessary for the predicted disasters. So far, there haven't been signs of those feedbacks.
In short, you can flood the conversation with CO2 studies and facts, but it does not change the basic science.
Arn, I believe you are sincere in your beliefs, but just because you don't understand (or perhaps don't put in the time and effort to understand) the "studies and facts" does not mean they are invalid. I'm sorry, but your understanding of "basic science" and statistical analysis, at least as presented in this thread, is sorely lacking.
quote
He states "Scientists had known for decades that global increases in CO2 could theoretically warm the atmosphere" but notice the word "theoretically"
"Theoretically" in the same sense that we still refer to the "Theory of Gravity." We know and can precisely calculate the effect of gravity on masses, including ourselves, but we still don't understand exactly what "gravity" is. That certainly doesn't mean that the Theory of Gravity is invalid. Lack of complete understanding does not necessarily invalidate what we do know with a high degree of certainty.
quote
Look at it this way
425 1,000,000,000
This puts it in some perspective.
You make the mistake here of assuming that a very small number imputes lack of significance. Potassium cyanide is fatal to humans at concentrations of less than 2 ppm (2 / 1,000,000 or 0.0002%). It's a small number, but it's still significant.
As another example, both the WHO and CDC state that "a residual concentration of free chlorine of greater than or equal to 0.5 mg/litre" (could also be expressed as 0.5 ppm, 500 ppb, 500 / 1,000,000,000, or 0.00005%) is sufficient for "effective disinfection" of public drinking water supplies. (Source.) Again, this is a very small number (virtually identical to your example) that's still highly significant to human health.
Here's another way of looking at it. A mole of water (18 grams, slightly more than 1 tablespoon) contains 6 x 10²³* molecules. If you add chlorine (or anything else) to achieve a concentration of only 500 ppb (500 / 1,000,000,000), that means the same tablespoon of water now contains approximately 3 x 10¹⁷ (300,000,000,000,000,000) of the "other kind" of atoms. 500 ppb may be a small concentration, but 3 x 10¹⁷ is still a huge number of atoms.
This figures shows estimates of the changes in carbon dioxide concentrations during the Phanerozoic. Three estimates are based on geochemical modeling: GEOCARB III (Berner and Kothavala 2001), COPSE (Bergmann et al. 2004) and Rothman (2001). These are compared to the carbon dioxide measurement database of Royer et al. (2004) and a 30 Myr filtered average of those data. Error envelopes are shown when they were available. The right hand scale shows the ratio of these measurements to the estimated average for the last several million years (the Quaternary). Customary labels for the periods of geologic time appear at the bottom.
Direct determination of past carbon dioxide levels relies primarily on the interpretation of carbon isotopic ratios in fossilized soils (paleosols) or the shells of phytoplankton and through interpretation of stomatal density in fossil plants. Each of these is subject to substantial systematic uncertainty.
Estimates of carbon dioxide changes through geochemical modeling instead rely on quantifying the geological sources and sinks for carbon dioxide over long time scales particularly: volcanic inputs, erosion and carbonate deposition. As such, these models are largely independent of direct measurements of carbon dioxide.
Both measurements and models show considerable uncertainty and variation; however, all point to carbon dioxide levels in the past that have been signifcantly higher than they are at present. While the GEOCARB Carbon dioxide levels in the most part of the Phanerzoic Eon shows a fit and resultíng climate sensitivity similar to todays values, the early Phanerozoic includes a global ice age during the Ordovician age combined with high atmospheric carbon contents based on the same project. There have been different speculations about the reasons but no acknowledged mechanism so far.
Atmospheric CO2 is positively correlated with globally averaged surface temperatures for most of the Phanerozoic. This pattern has been previously shown at coarse 10-million-year timescales and is demonstrated here at finer resolutions (one million to five million-year timescales). The two longest-lived Phanerozoic glaciations during the Permo-arboniferous and late Cenozoic are the only Phanerozoic intervals associated with consistently low levels of CO2 (<500 ppm). This pattern supports predictions from global climate models for a CO2 -ice threshold of 560–1120 ppm (DeConto and Pollard, 2003; Pollard and DeConto, 2005).
A growing number of cool, putatively non-glacial periods have been identified in the Phanerozoic. A pervasive pattern with these events is their brevity, typically <3 my and often <1 my. These cool periods are marked by either low-to-moderate levels of CO2 (<1000 ppm) or no CO2 coverage. Crucially, none of the cool periods are associated with CO2 levels exceeding 1000 ppm. Many factors are important in controlling the average surface temperature of the Earth, including solar luminousity, albedo, distribution of continents and vegetation, orbital parameters, and other greenhouse gases. The message of this study is not that atmospheric CO2 is always the dominant forcing (see Section 3.7 for an early Paleogene example). Instead, given the variety of factors that can influence global temperatures, it is striking that such a consistent pattern between CO2 and temperature emerges for many intervals of the Phanerozoic. This correspondence suggests that CO2can explain in part the patterns of globally averaged temperatures during the Phanerozoic
Arn, I believe you are sincere in your beliefs, but just because you don't understand (or perhaps don't put in the time and effort to understand) the "studies and facts" does not mean they are invalid. I'm sorry, but your understanding of "basic science" and statistical analysis, at least as presented in this thread, is sorely lacking.
Marvin you are making the classic mistake all GW enthusiasts make. They simply believe that any scientist who disagrees with them, or any good 'ol boy who simply doesn't believe them, is an ignoramus.
I keep asking the same questions that nobody who fancies themselves to be Einstein seems to be able to answer.
1. Al Gore, the IPCC and the National Weather Service all predicted we would be inundated with hurricanes and other violent weather due to Global Warming. This was based on "scientific analysis". So, where are all the hurricanes? In fact in recent years the incidents are lower not higher. So what about it?
2. The same folks were trumpeting the demise of the polar bear. Bogus videos were produced aiming to convince us that polar bears were starving and drowning due to Global Warming. Nothing could be farther from the truth. The population of polar bears world wide has risen by at least 5 times to 26,000 in the past few decades. In fact, there are so many, they are fighting over territory and raiding human settlements as they spread their territories. So where are all the dead polar bears?
3. The same people predicted as long as 13 years ago that we would see, within 10 years, the inundation of the Maldives, and even New York City. This just hasn't happened. Why not?
4. The actual rise in global temperature has been less than 1 degree F in the past decade, well within the normal fluctuations. Why did it not go up the predicted amounts?
5. The polar ice cap was supposed to disappear. It hasn't, and is back within its usual freeze/thaw cycle. Why is this?
In short, when these lying SOB's in East Anglia, and the IPCC made these outlandish predictions, they either did not know what they were talking about, or they were deliberately deceiving the public to obtain grants for their research.
So why do you think the readers of these reports should take them seriously? They have been proven to be errant and or untruthful any number of times both in terms of content which is often skewed, and outcomes that do not materialize.
And still, no one seems to be able to answer those 5 questions in defence of the big lie.
Currently I have considered opposing opinions on the issue of CO2's weight and ability to migrate throughout the atmosphere. I also have been searching through attempts to explain the difference in concentration of each layer of our atmosphere.
Explanation: against CO2 concentrations. CO2 weighs almost 2 times heavier than the Air. CO2 settles to lower levels. CO2 rise when heated so the temperature lead CO2 levels. (it's heavier and only rises when heat is applied causing it's density to be lower)
Explanations: For CO2 concentrations. CO2 is a gas and with gas, density decreases as temperature increases. * CO2 released from dry ice settles because of it's temperature * CO2 traps radiant heat so CO2 leads temperature. (it rises as soon as it's emitted because exhaust temperature is higher than ambient)
The ACE satellite provided measurements of CO2 at various locations and altitudes. This data, from 2004 (November) to 2008 (July), shows CO2 concentrations in a range from 374 to 388 ppm, between 40 and 60 N Latitude, at an altitude from 9 to 10 km above sea level: i.e., upper troposphere. (See red colored data.)
This is Figure 5 from the following source: Carbon dioxide atmospheric vertical profiles retrieved from space observation using ACE-FTS solar occultation instrument http://www.atmos-chem-phys....acp-11-2455-2011.pdf
Yeah, it's really up there!
[This message has been edited by rinselberg (edited 09-03-2013).]
I keep asking the same questions that nobody who fancies themselves to be Einstein seems to be able to answer.
1. Al Gore, the IPCC and the National Weather Service all predicted we would be inundated with hurricanes and other violent weather due to Global Warming. This was based on "scientific analysis". So, where are all the hurricanes? In fact in recent years the incidents are lower not higher. So what about it?
2. The same folks were trumpeting the demise of the polar bear. Bogus videos were produced aiming to convince us that polar bears were starving and drowning due to Global Warming. Nothing could be farther from the truth. The population of polar bears world wide has risen by at least 5 times to 26,000 in the past few decades. In fact, there are so many, they are fighting over territory and raiding human settlements as they spread their territories. So where are all the dead polar bears?
3. The same people predicted as long as 13 years ago that we would see, within 10 years, the inundation of the Maldives, and even New York City. This just hasn't happened. Why not?
4. The actual rise in global temperature has been less than 1 degree F in the past decade, well within the normal fluctuations. Why did it not go up the predicted amounts?
5. The polar ice cap was supposed to disappear. It hasn't, and is back within its usual freeze/thaw cycle. Why is this?
And still, no one seems to be able to answer those 5 questions in defence of the big lie.
The ACE satellite provided measurements of CO2 at various locations and altitudes. This data, from 2004 (November) to 2008 (July), shows CO2 concentrations in a range from 374 to 388 ppm, between 40 and 60 N Latitude, at an altitude from 9 to 10 km above sea level: i.e., upper troposphere. (See red colored data.)
This is Figure 5 from the following source: Carbon dioxide atmospheric vertical profiles retrieved from space observation using ACE-FTS solar occultation instrument http://www.atmos-chem-phys....acp-11-2455-2011.pdf
Yeah, it's really up there!
And temperatures still aren't. Does that mean the debate is over now?
Marvin you are making the classic mistake all GW enthusiasts make. They simply believe that any scientist who disagrees with them, or any good 'ol boy who simply doesn't believe them, is an ignoramus.
<snip>
The models are an obvious approximation of the climate system. Just because the models are not exact (warming is less than predicted, but warming is still occurring) doesn't mean the science is a lie.
fierobear already posted a bunch of data on natural cyclical variations. These cycles could easily influence the short term climate outlook in the 25-year window. The long term trend, which isn't affected by cycles, still shows distinct warming trends.
The map above shows global temperature anomalies for 2000 to 2009. It does not depict absolute temperature, but rather how much warmer or colder a region is compared to the norm for that region from 1951 to 1980. Global temperatures from 2000–2009 were on average about 0.6°C higher than they were from 1951–1980. The Arctic, however, was about 2°C warmer.
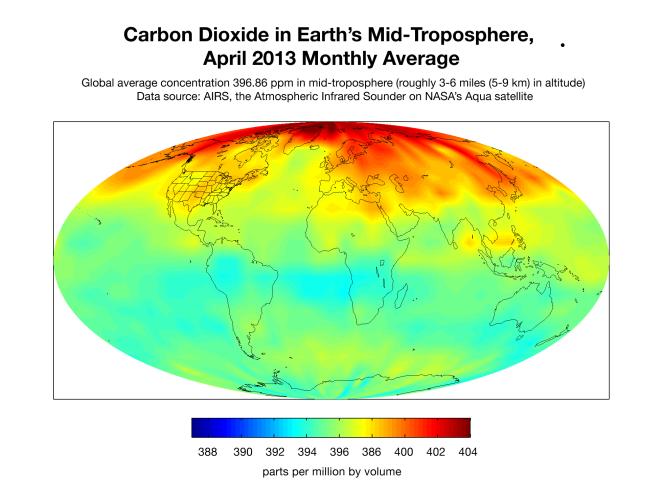
This map created with data from the Atmospheric Infrared Sounder (AIRS) on NASA's Aqua satellite shows the concentration of carbon dioxide in Earth's mid-troposphere, located roughly between 3 to 6 miles (5 to 9 kilometers) in altitude. Darker red colors correspond to higher concentrations of carbon dioxide, which are seen mostly in the northern latitudes. This is a typical pattern for this time of year, which follows the die-off of vegetation in winter when soil and plants release carbon dioxide into the atmosphere. Much of the regional variability seen in this map is due to weather patterns that move higher concentrations of carbon dioxide from Earth's surface into and out of the mid-troposphere where the AIRS instrument detects carbon dioxide best. The concentration of carbon dioxide in the mid-troposphere lags the concentration found at the surface as mixing from the lower to upper altitudes usually takes days to weeks. In addition, changes in concentration of carbon dioxide at Earth's surface are not always carried up to higher altitudes.
[This message has been edited by jmclemore (edited 09-04-2013).]
fierobear already posted a bunch of data on natural cyclical variations. These cycles could easily influence the short term climate outlook in the 25-year window. The long term trend, which isn't affected by cycles, still shows distinct warming trends.
Yes there is a warming trend. It started at the end of the last ice age and continues to this day.
It started without the help of modern society, and continues on with or without us.
One thing you can count on, with this subject is, that if it is colder it is due to "climate change" aka Global Warming, and if it is warmer, then it is all our fault and nothing to do with natural cyclical variations, the sun, or the tilt of the earth.
I'm leaning back toward Global Warming being a natural occurrence. The conversion of co2 between states of solid gas and liquid just are not convincing me that it can cause temperatures to rise. But the information is referenced for some biased sources.
I'm sure there is a counter claim. So I'll be back......