Originally posted by fierobear: I said you just repeat yourself, and you give me FIVE EXAMPLES of you repeating yourself.
I wouldn't have to repeat myself if you were capable of understanding me the first time. There's no sense in bringing anything new to the table if you cannot comprehend what's already on the table. You criticize me for repeating myself but you continue to repeat arguments that have been completely debunked.
You have yet to demonstrate how what I'm saying is false. If it is false I wouldn't repeat it. So please enlighten me as to how your "R squared correlation" theory makes sense when it doesn't apply in the real world.
quote
Originally posted by fierobear: It appears you missed these in your redirection...
Solar output has already been debunked completely. Solar output may have effected the planet in the past over long periods of time but it is currently not causing the warming. Source.
quote
Originally posted by fierobear: Here is a research paper from Dr. Roy Spencer that suggests climate sensitivity is low, and that once again the PDO is a better explanation for climate changes.
This is old completely debunked information. This would make the SIXTH time I debunk the PDO for you but you continue to repeat debunked arguments. The blogpost doesn't even conclude definitively if PDO is a major force or not, it just says "the next few years of data MIGHT provide insights." Guess what?
Temperature rises as PDO remains flat. This indicates the total energy of Earth's system is increasing proving PDO is not at fault. Source.
As the BEST study concludes, CO2 is still the best explanation. Source.
quote
Originally posted by fierobear: ...and now onto feedbacks. The major feedback from increased CO2 would be water vapor, in the form of clouds. Here are two published papers, one that shows that cloud feedbacks are *negative* instead of positive, and subsequent supporting evidence.
Your "subsequent supporting evidence" is not very good. The data in your study is collected by human observers taking notes on the cloud type and height for aviation purposes- not scientific analysis.
The paper concludes that although certain types of clouds have decreased, others have increased. It should also be noted that cumulonimbus clouds are associated with thunderstorms and atmospheric instability - like severe weather - how's that for feedback?: Source.
You should try to link to your actual scientific sources rather than a paywall.
[This message has been edited by FlyinFieros (edited 12-18-2012).]
Originally posted by Mickey_Moose: You obviously didn't watch (or read) the video I posted that talks about the correlation of temperature and CO2 (from a PUBLISHED paper).
Oh I read it. Reality differs with most of it. He holds many illogical views that might entertain someone who isn't the wiser. I was avoiding interacting with you because you do not return with organized arguments, just questions you don't try to answer on your own. I will however humor you because your post indicates I'm "obviously" missing something.
I almost stopped reading when he declared "Human activities have had no detectable impact on climate" and even if we did it "MIGHT BE beneficial." He of course declares this without providing proof of either. It should be noted the paper's focus is about developing a "sensible" energy policy rather than debating climate change. Before he gets too deep he claims his paper will demonstrate how the "human/climate connection" is conjecture. Yet his paper is full of conjecture that isn't supported by scientific evidence. He does not cite one single scientific study or source to backup his claims about the climate in points 1-6. His claims about the climate, by definition, are pure conjecture.
But I'll take you through his 6 climate points and demonstrate with sources how his points are unsubstantiated.
1) "Until people can explain what caused the 'Medieval Warm Period' we can't say the warming we are seeing is unusual" Temperatures during the MWP actually balanced out with some areas warmer than normal while others were cooler than normal. Evidence suggests that even where Medieval Warming was most prominent, current temperatures are now beyond what they were during Medieval times.
The Medieval Warm Period actually has known causes. The warming was a result of less volcanic activity and more than normal solar radiation. Source
1 = completely debunked
2) He simply asks a question that has already been answered by his first climate point: "why did the climate start getting warmer 400 years ago? Whatever the answer, it cannot be because of the Industrial Revolution."
He is correct here, more than normal solar output and less volcanic activity was not caused by the Industrial Revolution. Although he is probably being facetious here, these causes are not to blame for the current warming like he implies.
2 = completely debunked
3) This snippet is very facepalm worthy:
quote
However, it just happened that with human emissions the climate got actually colder. As you can see in Fig. 2, in the years 1945-1970 – during and right after the baby-boom, industrial-boom and emission-boom period – the climate did get colder. Cold to the point that during the Seventies there was, as popular as the global-warming fear is today, a fear for an oncoming glacial era (or, at any rate, for an oncoming period of global cooling). So, you do have a proof that the climate conjecture is quite wrong: things have happened that are the opposite than those expected from the conjecture.
He's sitting somewhere between very misleading and flat out wrong.
Global cooling was conjecture during the 1970's, he is correct about that. He completely fails to mention that although "the media" ate up the latest story to scare humanity with, the scientists still predicted future warming. Only 10% of the papers at the time predicted future cooling. wiki
He's trying to relate "global cooling of the 1970's" to "global warming of the 1990's+" as if "global warming" is newer than "global cooling." He's trying to draw the line of "we were wrong then and we are wrong now." Historically false.
3 = completely debunked
4) He loosely states that while CO2 output has climbed steadily, temperatures haven't climbed in the last 10 years.
The BEST study notes it's very hard due to statistical uncertainty to determine changes over short periods of time like 13-15 years:
quote
Some people draw a line segment covering the period 1998 to 2010 and argue that we confirm no temperature change in that period. However, if you did that same exercise back in 1995, and drew a horizontal line through the data for 1980 to 1995, you might have falsely concluded that global warming had stopped back then. This exercise simply shows that the decadal fluctuations are too large to allow us to make decisive conclusions about long term trends based on close examination of periods as short as 13 to 15 years.
5) He states lack of a troposphere warming "hotspot" disproves global warming.
He really should have disclosed the uncertainty of this point. The data only deviates from what is expected when the uncertainty of the data is highest. There is a degree of uncertainty because of how the teams make adjustments. More importantly, the data we have isn't definitive enough to say beyond any doubt there is no hotspot. link
5 = debunked
6) He concludes that the "climate/human connection conjecture is false"
Well English probably isn't his first language so I wont knock him too hard here. Of course conjecture is false. I'm not going to try to prove conjecture to be true.
It's been proven by multiple studies the "climate/human connection" is not conjecture and therefore not false. The BEST study most notably which looked at these issues in detail and have concluded the warming we are seeing is a result of human activity. The BEST study also confirmed the results of the previous major climate studies NASA, NOAA, Hadley. link
6 = completely debunked
Out of 6 points I'm going to rule myself a modest 5.2 despite how misleading his 5th point is.
[This message has been edited by FlyinFieros (edited 12-19-2012).]
Originally posted by FlyinFieros: There's zero scientific basis for the claim temperatures have been flat.
This is flat out WRONG. EVERY major temperature set shows flat temperatures, including the well known HadCRUT. That means both surface temperatures and satellite measurements. Can you show where any of the scientists are saying that they were wrong, and that the BEST study was right on this point?
Originally posted by FlyinFieros: Solar output has already been debunked completely. Solar output may have effected the planet in the past over long periods of time but it is currently not causing the warming.
This statement proves two things:
1. You aren't as informed as you think
2. You aren't paying attention.
I'll deal with this later, after I'm done with work.
I like how you say items from a 2012 study/published paper are completely debunked by a 2010 article.
If you are going to say something is debunked, please have the courtesy of quoting or using an article of a newer date as science is ever progressing.
From the page you linked:
quote
Last updated on 30 August 2010 by robert way.
You keep talking about people to provide you with current information, so please provide a source to current information that debunks the information he talks about - there has been research done since 2010.
quote
Originally posted by FlyinFieros:
The BEST data shows warming of .36*C per decade in the last 17 years.
To BORROW your quote - cherry picking data - you are showing a chart from 17 years that proves your arguement.
From your link:
quote
Please note that it starts in January 2001 and ends in May 2010, so it covers a tiny bit less than a decade! That’s a great big “red flag.”
So they add an extra 7 years onto the data to show what they want it to say.
Then it goes on to say and talk about the warming rate and shows a chart since 1975:
quote
Here’s the kicker: the uncertainty in those trend rates is probably higher, perhaps by a substantial amount, because that graph is based on an AR(1) model for the noise. Using an ARMA(1,1) model instead gives this:
That shows just how mistaken, how foolish, how downright boneheaded it is to say that “There is no scientific basis for saying that warming hasn’t stopped.”
WOW - look at that, sure looks to me that the warming rate is dropping off.
[This message has been edited by Mickey_Moose (edited 12-18-2012).]
Moose, I was up front with you in my initial reply. I said I was avoiding interacting with you because you do not return with organized arguments. While you didn't ask any direct questions this time you're raising questions about my sources that you could have researched on your own. If your thoughts pan out to show zero merit you're better off not saying anything. You're doing the skeptical argument a complete disservice by returning to this thread with bad arguments that are easily shredded with reality.
quote
Originally posted by Mickey_Moose: I like how you say items from a 2012 study/published paper are completely debunked by a 2010 article.
Let's get a few things straight about your "paper".
It's not a scientific paper. The paper was not submitted for peer review. The author provides absolutely zero sources for his claims about the climate. The "publisher" is a far right wing political group in Europe, not a scientific organization. The paper has zero merit.
If this was a new paper, citing new data, or a new method that corrects previous studies you would have ground to stand on. This is not the case. Therefore you have zero ground to stand on. At best what the author has written is an opinion piece. For you to take an opinion paper, citing zero scientific sources, and present it as fact is counter productive for the "skeptical" argument to be taken seriously.
quote
Originally posted by Mickey_Moose: If you are going to say something is debunked, please have the courtesy of quoting or using an article of a newer date as science is ever progressing.
From the page you linked: Last updated on 30 August 2010 by robert way.
You keep talking about people to provide you with current information, so please provide a source to current information that debunks the information he talks about - there has been research done since 2010.
I'm not responsible for your far right wing political group being out of date on information.
It really makes me chuckle that you're questioning the 2010 date on my scientific source with your opinion paper provides zero sources to compare it to. Political sources, especially far right wing sources, have a long documented history of being out of date on scientific evidence. They also have a long history of lacking common sense. For example, Bill O'reilly claims the "unexplainable" ocean tides proves the existence of God.
If you wanted a second opinion on the "Medieval Warm Period" all you had to do was Google it. The first link takes you to a Wiki article that agrees with my source. Current temperatures are way above the Medieval Warm Period: Source.
If you wanted a newer date than "2010" you only had to click the "Intermediate" button on the Skeptical Science link. "Last updated 19 February 2012 by dana1981." This newer post links to a scientific study discussing the volcanic and solar radiative forcing that caused the Medieval Warm Period. link
quote
Originally posted by Mickey_Moose: To BORROW your quote - cherry picking data - you are showing a chart from 17 years that proves your arguement.
So they add an extra 7 years onto the data to show what they want it to say.
I would hardly call it cherry picking data is because I was up front and honest with you about the statistical uncertainty in analyzing short time periods.
That's the major difference between the Denier's and myself. In my first post in this thread I also discussed this.
quote
Originally posted by fierobear: This is flat out WRONG. EVERY major temperature set shows flat temperatures, including the well known HadCRUT. That means both surface temperatures and satellite measurements. Can you show where any of the scientists are saying that they were wrong, and that the BEST study was right on this point?
You are seriously lacking an understanding of the statistical uncertainty that comes with analyzing short time periods. I will address this at the bottom of my post.
quote
Originally posted by fierobear: This statement proves two things:
1. You aren't as informed as you think
2. You aren't paying attention.
I feel this way about most of your statements.
You assumed these two things without much context. Allow me to supply some and you can elaborate on what I'm missing.
The Medieval Warm Period, a period of roughly 300 years, reached its thermal maximum at 150 years. We have exceeded the Medieval Warm Period in the last 50 years. 50 years vs 150 years.
quote
Originally posted by fierobear: I'll deal with this later, after I'm done with work.
Really? Negligible and irrelevant solar output "crossed the line"?
Considering we got started on this argument because of the disinformation you were spreading about the "IPCC leak" - the subsequent links provided on your questionable blog are completely irrelevant to the main issue: a single cherry picked sentence is being demonstratibly blown out of proportion by climate Deniers.
quote
Originally posted by fierobear: Or, at worst, FLAT. Gee...just like we and all the datasets have been saying. Imagine that!
quote
Originally posted by Mickey_Moose: WOW - look at that, sure looks to me that the warming rate is dropping off.
You know, I really shouldn't have to show two grown men how to read a graph. Especially after one of those grown men accused me of "not paying attention" and "not being as informed as I think I am."
Once again I will take time out of my day to educate you two on what you're looking at.
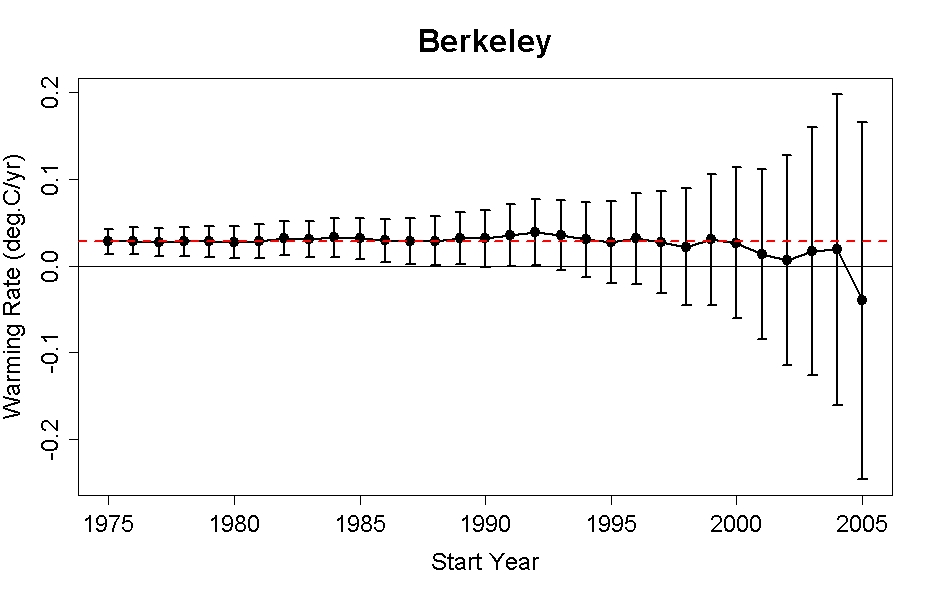
Let's get the basics out of the way because one of you failed right out the gate here. The X axis has years 1975 to 2005. The Y axis has the warming RATE of degree centigrade per year.
The Y axis does not represent a flat "temperature" from 1975 to 2005 like fierobear assumed.
The vertical bars are uncertainty, both of you missed that. The dots are the middle of the uncertainty. The actual averaged rate could statistically fall anywhere on those bars.
Notice how large the uncertainty starts to get after 1990. This is what makes graphs that show a short time period statistically unreliable. This is the basis for my statement of "there's zero scientific basis for the claim temperatures have been flat for 10 years." The uncertainty is too large to say for certain.
When you see political articles declaring "Temperatures have been flat for the last 10 years" notice how they completely fail to mention the uncertainty of the measurements. At least I'm up front and honest about the uncertainty, it's the first thing I tell you.
[This message has been edited by FlyinFieros (edited 12-19-2012).]
OH, good GOD, you didn't seriously just post THAT graph!? It's been debunked. But maybe if you keep repeating it enough...
quote
Originally posted by FlyinFieros: If you wanted a second opinion on the "Medieval Warm Period" all you had to do was Google it. The first link takes you to a Wiki article that agrees with my source. Current temperatures are way above the Medieval Warm Period:
And no, the temperatures are NOT "way above" the Medieval Warm Period.
Originally posted by FlyinFieros: Really? Negligible and irrelevant solar output "crossed the line"?
No acknowledgement of how illogical your "R Squared Correlation" theory is (this is the 7th time I have confronted you with it, the previous 6 you ignored)? Any acknowledgement of how PDO is not at fault for global warming? No acknowledgment of the climate feedbacks evident in your OWN scientific papers show cumulonimbus clouds - severe weather clouds - are on the rise? No acknowledgement of the disinformation you are spreading about the "IPCC leak"? No acknowledgement on how out of context your hype and BS argument about the IPCC leak is? No acknowledgement of how silly your Alien Warming Theory is?
Considering we got started on this argument because of the disinformation you were spreading about the "IPCC leak" - the subsequent links provided on your questionable blog are completely irrelevant to the main issue: a single cherry picked sentence is being demonstratibly blown out of proportion by climate Deniers.
Slow down. I gave no acknowledgement to this yesterday because I didn't have time. I had to leave for work. I didn't have time last night because I had a root canal after work, and didn't even turn on my computer. I won't have time this morning, either. But go ahead and TROLL me, if that's what you feel you must do. You see, you aren't the most important thing in my life, nor is this argument.
Moose, I was up front with you in my initial reply. I said I was avoiding interacting with you because you do not return with organized arguments. While you didn't ask any direct questions this time you're raising questions about my sources that you could have researched on your own. If your thoughts pan out to show zero merit you're better off not saying anything. You're doing the skeptical argument a complete disservice by returning to this thread with bad arguments that are easily shredded with reality.
You know, I really shouldn't have to show two grown men how to read a graph. Especially after one of those grown men accused me of "not paying attention" and "not being as informed as I think I am."
Once again I will take time out of my day to educate you two on what you're looking at.
Let's get the basics out of the way because one of you failed right out the gate here. The X axis has years 1975 to 2005. The Y axis has the warming RATE of degree centigrade per year.
The Y axis does not represent a flat "temperature" from 1975 to 2005 like fierobear assumed.
The vertical bars are uncertainty, both of you missed that. The dots are the middle of the uncertainty. The actual averaged rate could statistically fall anywhere on those bars.
Notice how large the uncertainty starts to get after 1990. This is what makes graphs that show a short time period statistically unreliable. This is the basis for my statement of "there's zero scientific basis for the claim temperatures have been flat for 10 years." The uncertainty is too large to say for certain.
When you see political articles declaring "Temperatures have been flat for the last 10 years" notice how they completely fail to mention the uncertainty of the measurements. At least I'm up front and honest about the uncertainty, it's the first thing I tell you.
Am I reading what you wrote correctly? Did you ACTUALLY completely misunderstand the above graph, AND leave out a quote from Muller himself that acknowledges temperatures are basically flat? And your misunderstanding of the data versus the error bars? The graph ends in 2005. That's 7 years ago. Why do you keep repeating it?
Quoting (from YOUR link):
Richard Muller, the target of Curry’s ire, also managed to embarrass himself:
However, he admitted it was true that the BEST data suggested that world temperatures have not risen for about 13 years. But in his view, this might not be ‘statistically significant’, although, he added, it was equally possible that it was – a statement which left other scientists mystified.
Of course we’re mystified. Didn’t you do the analysis? Don’t you know? Honestly, what kind of insane world do we live in when we get this level of discussion about one of the most crucial issues of our time, from people who are supposed to be scientists?
fierobear, we've talked about you getting faulty information from political sources.
Do you have a better source than the "Mohammed portraits" guy?
Every single point at that website is CITED. If you won't acknowledge that, and instead go to the ad homenim argument, then we cannot have a serious discussion of this subject.
This article is based on a paper by one of us (Robert Fawcett), Has the world cooled since 1998?, published in the Bulletin of the Australian Meteorological and Oceanographic Society in December 2007. Relevant references (e.g., on Mt Pinatubo and global temperatures, and on the removal of the ENSO signal from global temperatures) are given therein. The full December 2007 issue of BAMOS is available at http://www.amos.org.au/documents/item/82
but, thankfully - in a region that used to have snow by thanksgiving - I have yet to shovel. only had to shovel once last year. ONCE - in the winter wonderland. the year before - winter was soft - but had some good snow days.
looking forward to global warming. been nice sofar. Does Michigan good. global warming does have good points.
and, how about checking in with insurance companies. are they showing signs of adjusting policies on coastal properties?
Hey, speak for yourself, I have been shovelling since middle of October (the last few years have been like this) when it used to be normally November and as of late our daytime high has been lower than the average pretty much all year.
Originally posted by FlyinFieros: Moose, I was up front with you in my initial reply. I said I was avoiding interacting with you because you do not return with organized arguments. While you didn't ask any direct questions this time you're raising questions about my sources that you could have researched on your own.
You were avoiding interacting with me becuase I didn't have any organized arguements even though I picked out flaws in your posts? Just so I am clear - it is OK for you to question my sources and post about my flaws, but not ok for me to question yours? You are really arrogant aren’t you?
quote
Originally posted by FlyinFieros: I would hardly call it cherry picking data is because I was up front and honest with you about the statistical uncertainty in analyzing short time periods.
Why is it when someone as myself quotes a short time period it is cherry picking, but when you use it, it is perfectly fine and “hardly cherry picking”? Just because I happen to disagree with you doesn’t mean that the definition should change.
quote
Originally posted by FlyinFieros: You are seriously lacking an understanding of the statistical uncertainty that comes with analyzing short time periods. I will address this at the bottom of my post.
So what you are saying is 17 years is long enough? See above.
quote
Originally posted by FlyinFieros: You know, I really shouldn't have to show two grown men how to read a graph. Especially after one of those grown men accused me of "not paying attention" and "not being as informed as I think I am."
Once again I will take time out of my day to educate you two on what you're looking at.
Let's get the basics out of the way because one of you failed right out the gate here. The X axis has years 1975 to 2005. The Y axis has the warming RATE of degree centigrade per year.
The Y axis does not represent a flat "temperature" from 1975 to 2005 like fierobear assumed.
The vertical bars are uncertainty, both of you missed that. The dots are the middle of the uncertainty. The actual averaged rate could statistically fall anywhere on those bars.
Notice how large the uncertainty starts to get after 1990. This is what makes graphs that show a short time period statistically unreliable. This is the basis for my statement of "there's zero scientific basis for the claim temperatures have been flat for 10 years." The uncertainty is too large to say for certain.
When you see political articles declaring "Temperatures have been flat for the last 10 years" notice how they completely fail to mention the uncertainty of the measurements. At least I'm up front and honest about the uncertainty, it's the first thing I tell you.
So the vertical bar represents uncertainty, so then what you are saying is THEY DON'T KNOW.
Then you say since it is "uncertain" you say there is "zero scientific basis for the claim temperatures have been flat for 10 years" – HOWEVER, YOU CAN ALSO SAY - there is zero scientific basis that it is increasing.
quote
Originally posted by FlyinFieros: At least I'm up front and honest about the uncertainty, it's the first thing I tell you.
Let’s visit this again; you are still infering that with 100% assurance that global warming is man-made (and like pointing out all our flaws), but now you are saying you are “honest about the uncertainty”?
Also, for the record, if you don’t like the way us “grown men” are posting here, you are welcome to leave.
Let’s visit this again; you are still infering that with 100% assurance that global warming is man-made (and like pointing out all our flaws), but now you are saying you are “honest about the uncertainty”?
Statistically the long term data shows a clear warming trend. You can see in that graph the error bars are small and most years are positive, and even the years with uncertainty show a mean temperature rise above zero.
The short term data isn't useful because the error bars are too large. Which is why you can't use ONLY short term data to arrive at a conclusion.
quote
Also, for the record, if you don’t like the way us “grown men” are posting here, you are welcome to leave.
I would think that a healthy argument would be welcome. No point in posting in an echo chamber.
[This message has been edited by masospaghetti (edited 12-19-2012).]
Originally posted by fierobear: Slow down. I gave no acknowledgement to this yesterday because I didn't have time. I had to leave for work. I didn't have time last night because I had a root canal after work, and didn't even turn on my computer. I won't have time this morning, either. But go ahead and TROLL me, if that's what you feel you must do.
Then actually stay out. You keep climbing back into the ring. There's no sense in complaining and giving us your sob story.
My intention is not to troll you. My intention is present reality.
quote
Originally posted by fierobear: You see, you aren't the most important thing in my life, nor is this argument.
It sounds like you're saying this more to yourself than to me.
quote
Originally posted by fierobear: Every single point at that website is CITED. If you won't acknowledge that, and instead go to the ad homenim argument, then we cannot have a serious discussion of this subject.
Every single point is not cited. There isn't even an author listed. It's written by some anonymous right wing person who thinks "Mohammed portraits" are interesting (the "extreme" ones are downright disgusting and disturbing). He believes the conspiracy theory "climategate" emails are relevant to a scientific discussion.
Scientific data and sources are relevant as "evidence" in this thread. Politics is not.
As if that wasn't enough, your now infamous and illogical "R Squared Correlation" graphs that conclude without any evidence that PMO is more responsible than CO2 are presented as fact on this website. By the way this will make the 8th post I have confronted you with how meaningless the "R Squared Correlation" is and will probably be the 8th time you ignore it because you're wrong.
The website also has zero mention of the BEST study. I wonder why that is.
quote
Originally posted by fierobear: Am I reading what you wrote correctly? Did you ACTUALLY completely misunderstand the above graph, AND leave out a quote from Muller himself that acknowledges temperatures are basically flat? And your misunderstanding of the data versus the error bars?
Perhaps you should elaborate on my misunderstanding then. You haven't "got time" to elaborate on a whole host of issues but you have time to raise questions.
quote
Originally posted by fierobear: The graph ends in 2005. That's 7 years ago. Why do you keep repeating it?
The author notes he removed the outlier data (2006+) to compute the trend for each year because those points are "too-uncertain-to-be-useful data points."
Statistical uncertainty is relevant to the discussion. The graphs, despite "being 7 years behind", illustrate the point of statistical uncertainty perfectly. It is dishonest to present "temperatures have not risen in the last 10 years" as fact due to the uncertainty.
The author also illustrates how sensitive the results are for short time spans. From 2001-2010 the BEST data shows warming of 0.11*C per decade. From 2000-2010, just one more year, the results show warming of 0.27*C per decade.
quote
Originally posted by fierobear: However, he admitted it was true that the BEST data suggested that world temperatures have not risen for about 13 years. But in his view, this might not be ‘statistically significant’, although, he added, it was equally possible that it was – a statement which left other scientists mystified.
We are mostly in agreement here. Muller should have said what he did differently.
It is dishonest to flat out say "temperatures have not risen in 13 years" because of the uncertainty. However you accept the uncertainty of the record and just have to make a graph, the warming is all there. But how do you effectively communicate that point in a debate filled with so much hysteria?
quote
Originally posted by Mickey_Moose: You were avoiding interacting with me becuase I didn't have any organized arguements even though I picked out flaws in your posts? Just so I am clear - it is OK for you to question my sources and post about my flaws, but not ok for me to question yours? You are really arrogant aren’t you?
I didn't say you couldn't question my sources or pick out flaws. By all means pick apart my argument because I want to understand this very important issue as much as I can.
If your concerns are completely unsubstantiated you should pay attention to the technical reason and gracefully accept it. You didn't pick out any flaws in my argument in this instance.
You claimed my source was outdated (my 2010 vs your 2012) and superseded by "new" information. It turns out that "new" information comes from a biased far right wing political group that cites zero scientific sources or studies to backup their opinions. Your "paper" is a political opinion piece, not a scientific study.
quote
Originally posted by Mickey_Moose: Why is it when someone as myself quotes a short time period it is cherry picking, but when you use it, it is perfectly fine and “hardly cherry picking”? Just because I happen to disagree with you doesn’t mean that the definition should change.
So what you are saying is 17 years is long enough? See above.
It's not cherry picking if I tell you the faults.
quote
Originally posted by Mickey_Moose: So the vertical bar represents uncertainty, so then what you are saying is THEY DON'T KNOW.
Then you say since it is "uncertain" you say there is "zero scientific basis for the claim temperatures have been flat for 10 years" – HOWEVER, YOU CAN ALSO SAY - there is zero scientific basis that it is increasing.
Finally we get to agree on something!
You are absolutely correct here. "They don't know" much about the *recent* temperature record because of the uncertainty. There is zero scientific bases for the claim temperatures have been flat. Just so you're aware, one of the points I debunked in the paper you cited states temperatures have been flat for 10 years with zero mention of the uncertainty.
quote
Originally posted by Mickey_Moose: Let’s visit this again; you are still infering that with 100% assurance that global warming is man-made (and like pointing out all our flaws), but now you are saying you are “honest about the uncertainty”?
I sit in agreement with the scientific consensus and many scientific studies: the warming anomaly is being caused by human activity. CO2 is the best explanation.
We have uncertainty in the recent temperature record (last 15 years or so) but that's it. The long term data shows warming with very little uncertainty. Notice how the bars get smaller on that graph the further you go back in time.
quote
Originally posted by Mickey_Moose: Also, for the record, if you don’t like the way us “grown men” are posting here, you are welcome to leave.
Wow.
[This message has been edited by FlyinFieros (edited 12-19-2012).]
Statistically the long term data shows a clear warming trend. You can see in that graph the error bars are small and most years are positive, and even the years with uncertainty show a mean temperature rise above zero.
The short term data isn't useful because the error bars are too large. Which is why you can't use ONLY short term data to arrive at a conclusion.
Tell that to the other party that keeps posting and insisting about the 17 year warming trend (BEST data).
quote
Originally posted by FlyinFieros: It's not cherry picking if I tell you the faults.
It's cherry picking to show you the results you want. As I stated before, any experiment can be made to show the results you want by changing any parameter of the test or the way data is read. If you are so knowledgable, you would know this.
quote
Originally posted by FlyinFieros: You claimed my source was outdated (my 2010 vs your 2012) and superseded by "new" information. It turns out that "new" information comes from a biased far right wing political group that cites zero scientific sources or studies to backup their opinions. Your "paper" is a political opinion piece, not a scientific study.
"far right wing" because it is going against the "flow". Hate to bring it up, but Al Gore's opinion is not a political opinion piece?
Also for being so far right wing and "completely wrong", some how he was still invited to speak at the Energy-Climate policy Conference.
quote
Originally posted by FlyinFieros: We have uncertainty in the recent temperature record (last 15 years or so) but that's it. The long term data shows warming with very little uncertainty. Notice how the bars get smaller on that graph the further you go back in time.
You will also notice that the temperature is fairly flat in that graph the further you go back in time.
quote
Originally posted by FlyinFieros: Wow.
Hey you said it (about us grown men can't read a chart), I didn't.
I any event, I will continue to post things I find here - feel free to rip the posts all apart if you want as I am not going to waste the time and energy in countering you. Just remember there are many scienctist's that have gone on recent record to say man is not responsible (see an earlier post I made), and yes they will continued to probably be made fun of becuase they are going against the whole (and it probably hurts them in securing research grants), but it is what it is. Remember, Galileo was at first persecuted, besides, there is a lot more room out here on the right wing.
[This message has been edited by Mickey_Moose (edited 12-19-2012).]
Originally posted by Mickey_Moose: It's cherry picking to show you the results you want. As I stated before, any experiment can be made to show the results you want by changing any parameter of the test or the way data is read. If you are so knowledgable, you would know this.
No, reality shows the results. Those aren't the results "I want" - those are the results that are there. We have increased 0.9*C in the last 50 years alone. The warming is there. I may have picked a graph with a start date of 17 years ago but that's not cherry picking because I'm comparing the 17 year result to the 10, 13, and 16 year result. The more time you add the less uncertain you are about the result.
While any experiment can be tweaked to get a false result through fraud, if you release your data and your methods, the experiment should not be reproducible. If the false result is reproducible then you can identify a fallacy in the method used. The BEST results are reproducible. There is zero identifiable fallacy in their method. The fact that the BEST study confirm previous studies lends TONS of credibility to the result.
quote
Originally posted by Mickey_Moose: "far right wing" because it is going against the "flow". Hate to bring it up, but Al Gore's opinion is not a political opinion piece?
They are a far right wing fringe group going against the flow of current scientific evidence and reality. I'm sorry you have issues accepting reality.
quote
Originally posted by Mickey_Moose: You will also notice that the temperature is fairly flat in that graph the further you go back in time.
You still can't read the graph. The RATE is flat. Which means temperature is increasing constantly at the SAME rate. TEMPERATURES are not flat.
Originally posted by Mickey_Moose: Hey you said it (about us grown men can't read a chart), I didn't.
I said I shouldn't have to show a grown man how to read a graph. And I shouldn't. Especially anyone who says my argument is false. How can you comprehend my argument when you can't even comprehend a simple graph? Even after I took the time to explain it to you like you're my two year old.
quote
Originally posted by Mickey_Moose: Remember, Galileo was at first persecuted.
Oh I remember.
You are not Galileo. You are against the scientific consensus and reality. You are the church. We are 'Galileo'.
[This message has been edited by FlyinFieros (edited 12-19-2012).]
When did it become received media wisdom that global warming skepticism was all the work of shadowy right-wing groups lavishly funded by oil companies? As best we can tell, it started with a 1995 Harper's magazine article claiming to expose this "high-powered engine of disinformation." Today anyone who raises a doubt about the causes of global warming is accused of fronting for, say, Exxon, whatever the facts.
Now comes a rare glimpse inside the allegedly antiscience behemoth, with the online publication last week of documents purloined from the conservative Heartland Institute. The files appear to contain detailed financial, donor and personnel information and outline the think-tank's projects. Chicago-based Heartland says one of the documents is fake and warns that others may have been altered.
Given the coverage the story has generated, you'd think some vast conspiracy had been uncovered. Heartland is, according to the Associated Press, "one of the loudest voices denying human-caused global warming, hosting the largest international scientific conference of skeptics on climate change." The Vancouver Sun reports that it is "heavily funded by right-wing industrialist Charles Koch," while the Virginian-Pilot dubs it "the ideological center of the denial movement." Related Video
Heartland Institute President Joe Bast on why global warming activist Peter Gleick stole and forged documents from his organization.
So how flush is Heartland? The documents show the group is expecting revenues of $7.7 million this year, mostly from private donations and grants. Mr. Koch's "heavy" funding came to $25,000 in 2011, though the Heartland "Fundraising Plan" has it hoping for an increase in 2012. To put those numbers in not-for-profit perspective, last year the Natural Resources Defense Council reported $95.4 million in operating revenues, while the World Wildlife Fund took in $238.5 million.
Press coverage has focused in particular on Heartland's plans to produce and distribute "educational material suitable for K-12 students on global warming that isn't alarmist or overtly political." Heartland is budgeting $200,000 this year for the effort, which in the past has "had only limited success," per one of the documents. Little wonder if teachers aren't returning Heartland's calls: Last year the World Wildlife Fund spent $68.5 million on "public education" alone.
As for "the largest international scientific conference of skeptics," Heartland will, according to the documents, spend all of $388,000 this year on the Nongovernmental International Panel on Climate Change. That's against the $6.5 million that the U.N. Intergovernmental Panel on Climate Change costs Western taxpayers annually, and the $2.6 billion the White House wants to spend next year on research into "the global changes that have resulted primarily from global over-dependence on fossil fuels."
In the pages of Rolling Stone last summer, Al Gore warned of the "Polluters and Ideologues [sic] . . . . spending hundreds of millions of dollars each year on misleading advertisements in the mass media." He had the wrong spenders.
In case you are wondering where all the money goes...
The central problems for policymakers in the debate over global warming are (a) is the reported warming trend real and how significant is it? (b) how much of the warming trend is due to natural causes and how much is due to human-generated greenhouse gases? and (c) would the effects of continued warming be harmful or beneficial to plant and wildlife and to human civilization? In this NIPCC report we have presented evidence that helps provide answers to all three questions.
The extent of the modern warming – the subject of the first question – appears to be less than is claimed by the IPCC and in the popular media. We have documented shortcomings of surface data affected by urban heat islands and by the poor distribution of land-based observing stations. Data from oceans, covering 70 percent of the globe, are also subject to uncertainties. The only truly global observations come from weather satellites, and these have not shown any warming trend since 1998, for the past 10 years.
This report shows conclusively that the human greenhouse gas contribution to current warming is insignificant. Our argument is based on the well- established and generally agreed-to ‘fingerprint’ method. Using data published by the IPCC and further elaborated in the U.S.-sponsored CCSP report, we have shown that observed temperature- trend patterns disagree sharply with those calculated from greenhouse models. It is significant that the IPCC has never made such a comparison, or it would have discovered the same result – namely that the current warming is primarily of natural origin rather than anthropogenic. Instead, the IPCC relied for its conclusion (on AGW) on circumstantial ‘evidence’ that does not hold up under scrutiny.
We show that the twentieth century is in no way unusual and that warming periods of greater magnitude have occurred in the historic past – without any catastrophic consequences.
We also discuss the many shortcomings of climate models in trying to simulate what is happening in the real atmosphere.
If the human contribution to global warming due to increased levels of greenhouse gases is insignificant, why do greenhouse gas modelscalculate large temperature increases, i.e., show high values of ‘climate sensitivity’? The most likely explanation is that models ignore the negative feedbacks that occur in the real atmosphere. New observations reported from satellites suggest it is the distribution of water vapor that could produce such strong negative feedbacks.
If current warming is not due to increasing greenhouse gases, what are the natural causes that might be responsible for both warming and cooling episodes – as so amply demonstrated in the historic, pre-industrial climate record? Empirical evidence suggests very strongly that the main cause of warming and cooling on a decadal scale derives from solar activity via its modulation of cosmic rays that in turn affect atmospheric cloudiness. According to published research, cosmic-ray variations are also responsible for major climate changes observed in the paleo-record going back 500 million years.
The third question concerns the effects of modest warming. A major scare associated with a putative future warming is a rapid rise in sea level, but even the IPCC has been scaling back its estimates. We show here that there will be little if any acceleration, and therefore no additional increase in the rate of ongoing sealevel rise. This holds true even if there is a decades-long warming, whether natural or manmade.
Other effects of a putative increase in temperature and carbon dioxide are likely to be benign, promoting not only the growth of crops and forests but also benefiting human health. Ocean acidification is not judged to be a problem, as indicated by available data. After all, CO2 levels have been up to 20 times the present value during the hanerozoic Period, the past 500 million years. During this time Earth’s climate has been remarkably stable, with no ‘run-away’ greenhouse effects – indicating strong negative feedbacks.
If, for whatever reason, a modest warming were to occur – even one that matches temperatures seen during the Medieval Warm Period of around 1100 AD or the much larger ones recorded during the Holocene Climate Optimum of some 6,000 years ago – the impact would not be damaging but would probably be, on the whole, beneficial. [Lamb 1982, and Figure 26]
Policy Implications
Our findings, if sustained, point to natural causes and a moderate warming trend with beneficial effects for humanity and wildlife. This has obvious policy implications: Schemes proposed for controlling CO2 emissions, including the Kyoto Protocol, proposals in the U.S. for federal and state actions, and proposals for a successor international treaty to Kyoto, are unnecessary, would be ineffective if implemented, and would waste resources that can better be applied to genuine societal problems [Singer, Revelle and Starr 1991; Lomborg 2007].
Even if a substantial part of global warming were due to greenhouse gases – and it is not – any control efforts currently contemplated would give only feeble results. For example, the Kyoto Protocol – even if punctiliously observed by all participating nations – would decrease calculated future temperatures by only 0.02 degrees C by 2050 [re-calculated from Parry et al. 1998], an undetectable amount.
To sum up: This NIPCC report falsifies the principal IPCC conclusion that the reported warming (since 1979) is very likely caused by the human emission of greenhouse gases. In other words, increasing carbon dioxide is not responsible for current warming. Policies adopted and called for in the name of ‘fighting global warming’ are unnecessary.
It is regrettable that the public debate over climate change, fueled by the errors and exaggerations contained in the reports of the IPCC, has strayed so far from scientific truth. It is an embarrassment to science that hype has replaced reason in the global debate over so important an issue.
[This message has been edited by Mickey_Moose (edited 12-19-2012).]
Originally posted by FlyinFieros: Then actually stay out. You keep climbing back into the ring. There's no sense in complaining and giving us your sob story.
It wasn't a sob story. You asked me for answers, so I gave you the courtesy of an adult response . Instead of returning me the courtesy of an adult response, I got the usual arrogance, condescension and insults. I've had enough of your childish bullshit. Go troll someone who gives a crap.
[This message has been edited by fierobear (edited 12-19-2012).]
Originally posted by FlyinFieros: You still can't read the graph. The RATE is flat. Which means temperature is increasing constantly at the SAME rate. TEMPERATURES are not flat.
Ok, you got me on that one, I said flat when I should have said linear, but you will agree with me that the graph is linear (lets for go the drop right now), ok?
That being said, you will also agree with me that the earth has gone through these warming and cooling cycles before in the past?
I will also admit that since the dawn of man our CO2 output has increased (and I will submit that we need to reduce this along with land fill waste).
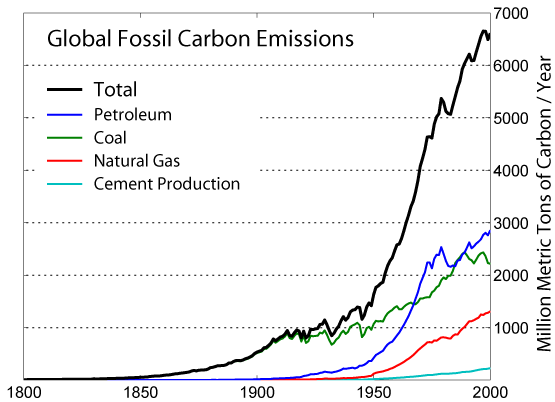
Now, the problem I have with this is, it is report that man's CO2 output is increasing every year and even the above chart posted shows this, BUT, the scale is logarithmic, yet the graph that "I can't read" is linear.
If CO2 output is the cause and is increasing logarithmic, the temperature increase would not be linear but would be logarithmic as well. Also to note that the temperature rate in the graph is shown to decrease, sure there is "the uncertainty" factor and it could increase, but there is just an equal chance that it will decrease (the "average" shows that it is).
My point here is that the science is by far 'settled' and you can not say the man made CO2 emissions are responsible looking at that graph as that data is not meshing with the increasing CO2 output.
[This message has been edited by Mickey_Moose (edited 12-20-2012).]
Originally posted by fierobear: It wasn't a sob story. You asked me for answers, so I gave you the courtesy of an adult response .
The courtesy of an adult response would have been to explain all the crazy things you believe. Forums are about discussion. Threads are not intended to be your personal megaphone.
It was a very childish response to stick your head in this thread only long enough to declare everything I'm talking about is wrong. But you can't stay long enough to tell us why, because you're too busy, your hip hurts, you're in the middle of cooking a turkey, and you have warranty cards to fill out.
quote
Originally posted by fierobear: Instead of returning me the courtesy of an adult response, I got the usual arrogance, condescension and insults.
I thought you could use a dose of convergent behavior.
quote
Originally posted by fierobear: I've had enough of your childish bullshit. Go troll someone who gives a crap.
"I've had enough of your facts. Go tell someone who is willing to listen."
quote
Originally posted by fierobear: No. But discussing it with certain people seems to be a waste of time.
Pardon me for assuming you should explain all the crazy things you believe in a thread discussing "evidence." But I suppose it's easier for you to ignore reality than to confront reality considering how much personal change it would warrant.
quote
Originally posted by Mickey_Moose: Ok, you got me on that one, I said flat when I should have said linear, but you will agree with me that the graph is linear (lets for go the drop right now), ok?
Moose, I really got to hand it to you. It takes a real man to admit he's wrong when he knows he is. I wasn't expecting to get any serious reply from you for the remainder of this thread but you came back with your most organized thought yet. If I've come across like a jerk I am sorry. It is frustrating to present solid evidence in a discussion and have it completely misunderstood simply because of perception. I will however say every human being has room to improve when it comes to perception.
We are in agreement on the graph if you accept some wording change: the warming rate is linear.
quote
Originally posted by Mickey_Moose: That being said, you will also agree with me that the earth has gone through these warming and cooling cycles before in the past?
Absolute agreement.
Context in respect to time is very important though. The most significant warming in the last 65 million years was 6*C over 20,000 years (Source). When you consider we've increased almost a full 1*C in the last 50 years alone it provides a stark comparison.
quote
Originally posted by Mickey_Moose: I will also admit that since the dawn of man our CO2 output has increased (and I will submit that we need to reduce this along with land fill waste).
Now, the problem I have with this is, it is report that man's CO2 output is increasing every year and even the above chart posted shows this, BUT, the scale is logarithmic, yet the graph that "I can't read" is linear.
If CO2 output is the cause and is increasing logarithmic, the temperature increase would not be linear but would be logarithmic as well. Also to note that the temperature rate in the graph is shown to decrease, sure there is "the uncertainty" factor and it could increase, but there is just an equal chance that it will decrease (the "average" shows that it is).
My point here is that the science is by far 'settled' and you can not say the man made CO2 emissions are responsible looking at that graph as that data is not meshing with the increasing CO2 output.
My first reaction to reading this was to knock you hard for simply "eyeballing" graphs and postulating a theory. I simply cannot do that because you made a VERY good observation that requires explanation.
When I declared the rate being flat, I was wrong. (graph in question) You can see the "middle dots" climb above the red dotted line that represents a "flat" rate. The rate does increase very slightly until the uncertainty becomes large. As you noted, it could very well mean the rate is decreasing because of the uncertainty however it is equally possible the rate is still increasing. I will come back to this admission so please do not take it out of context.
Back to your point, the increases in CO2 vs land surface temperature does not seem to be in proportion. This is because 90% of Earth's total energy increase is happening in the ocean, not in the air or on the surface.
Those who declare temperatures have been flat or temperatures are decreasing ignore increasing ocean heat content. While the uncertainty in the land temperature record makes it difficult to say for certain which way the surface temperatures rate will go, if you consider 90% of the warming is occurring in the ocean and is continuing, you can reasonably expect surface temperatures to follow.
[This message has been edited by FlyinFieros (edited 12-21-2012).]
A paper published today (May 16, 2012) in Geophysical Research Letters finds the oceans have warmed only 0.09°C over the 55 year period from 1955-2010. According to the authors, this resulted in a sea level rise of 0.54 mm per year [only 2.12 inches per century] and corresponds to 0.39 Watts per square meter of the ocean surface. However, the IPCC claims the increase in CO2 from 1955-2010 'should' have warmed the oceans by 1.12 Watts per square meter [5.35*ln(389.78/312) = 1.12 W/m2]. Thus, even if one assumes all ocean warming is due to increased greenhouse gases, the IPCC has exaggerated climate sensitivity to CO2 by a factor of almost 3 times [1.12/0.39]. [This is why Trenberth can't find his "missing heat"-it never existed in the first place]. In reality, greenhouse gases cannot warm the oceans at all because they radiate infrared which only penetrates the surface of water a few microns to cause evaporative cooling.
A paper published online today (FRIDAY, JULY 29, 2011) examines temperature measurements of the deep oceans that have been performed 2 or more times at 28 sites between 1980 and 2010. The paper concludes that warming of the global deep ocean abyss is contributing 0.053 mm/yr or 1/5 of 1 inch per century to global sea level rise.
Alarmists such as Kevin Trenberth et al claim the "missing heat" generated by greenhouse gases has somehow gone to the deep ocean, bypassing detection by satellites in the atmosphere or by thousands of ARGO floats monitoring the upper 1000 meters of the oceans. If the "missing heat" has teleported to the deep oceans, this paper suggests it is causing a trivial influence on global sea levels.
Once again, flyinfieros suffers from his malady of focusing too tightly on the wrong thing, once again missing the point. He drew his box around a small portion of the coverage of the material in the paper. If he would have been able to actually look at the bigger picture (and bothered to actually read the accompanying text), instead of focusing on the one graph I posted, he would have noticed the following important information:
A paper published today in Geophysical Research Letters finds the oceans have warmed only 0.09°C over the 55 year period from 1955-2010. According to the authors, this resulted in a sea level rise of 0.54 mm per year [only 2.12 inches per century]
Originally posted by fierobear: Once again, flyinfieros suffers from his malady of focusing too tightly on the wrong thing, once again missing the point. He drew his box around a small portion of the coverage of the material in the paper.
It's ironic you accuse me of focusing too tightly on the "wrong thing" yet you posted a very misleading graph that only shows 10 years of data. Your graph hides the incline.
quote
Originally posted by fierobear: If he would have been able to actually look at the bigger picture (and bothered to actually read the accompanying text), instead of focusing on the one graph I posted, he would have noticed the following important information:
More irony, you are the one who obviously needs to look at the bigger picture. You posted a graph that states "Ocean Heat Content Hasn't Risen" which is flat out wrong. My graph's purpose was to illustrate the bigger picture yours neglected.
quote
Originally posted by fierobear: A paper published today in Geophysical Research Letters finds [b]the oceans have warmed only 0.09°C over the 55 year period from 1955-2010. According to the authors, this resulted in a sea level rise of 0.54 mm per year only 2.12 inches per century
I read the accompanying text. It's irrelevant to your position because human activity is responsible for the warming. Source.
My first reaction to reading this was to knock you hard for simply "eyeballing" graphs and postulating a theory. I simply cannot do that because you made a VERY good observation that requires explanation.
When I declared the rate being flat, I was wrong. (graph in question) You can see the "middle dots" climb above the red dotted line that represents a "flat" rate. The rate does increase very slightly until the uncertainty becomes large. As you noted, it could very well mean the rate is decreasing because of the uncertainty however it is equally possible the rate is still increasing. I will come back to this admission so please do not take it out of context.
Back to your point, the increases in CO2 vs land surface temperature does not seem to be in proportion. This is because 90% of Earth's total energy increase is happening in the ocean, not in the air or on the surface.
Those who declare temperatures have been flat or temperatures are decreasing ignore increasing ocean heat content. While the uncertainty in the land temperature record makes difficult to say for certain which way surface temperatures will go, if you consider 90% of the warming is occurring in the ocean and is continuing, you can reasonably expect surface temperatures to follow.
Agree, but also on the contrary as the water warms it increases evaporation and will release more CO2 not to mention as water temp increases CO2 become less soluble in water, which it turn would increase the level of CO2 in the air. Kind of a no win situation.
Also to add, according to the Argos program the water temperature has increased even less than what fierobear has posted:
quote
Ocean temperature and heat content
Over the past 50 years, the oceans have absorbed more than 80% of the total heat added to the air/sea/land/cyrosphere climate system (Levitus et al, 2005). As the dominant reservoir for heat, the oceans are critical for measuring the radiation imbalance of the planet and the surface layer of the oceans plays the role of thermostat and heat source/sink for the lower atmosphere.
Domingues et al (2008) and Levitus et al (2009) have recently estimated the multi-decadal upper ocean heat content using best-known corrections to systematic errors in the fall rate of expendable bathythermographs (Wijffels et al, 2008). For the upper 700m, the increase in heat content was 16 x 1022 J since 1961. This is consistent with the comparison by Roemmich and Gilson (2009) of Argo data with the global temperature time-series of Levitus et al (2005), finding a warming of the 0 - 2000 m ocean by 0.06°C since the (pre-XBT) early 1960's.
Fresh water or salt water? At what pressure? Is it significant that CO2 can exist in liquid form and as unstable carbides at ocean depths below ~1000 feet.
I'm not disputing the graph, just pointing out some context variables that need to be known for it to be meaningful.
[This message has been edited by Marvin McInnis (edited 12-21-2012).]
Originally posted by FlyinFieros: It's ironic you accuse me of focusing too tightly on the "wrong thing" yet you posted a very misleading graph that only shows 10 years of data. Your graph hides the incline.
Your mistake was focusing on the graph, which was only ONE small portion of a paper that spans SIXTY years of data and another that spans 30 years. The graph was not intended as the complete answer.
quote
I read the accompanying text. It's irrelevant to your position because human activity is responsible for the warming.
Only if you make the following assumptions (ALL must be true):
1. We are responsible for the most or all the warming, and
2. Warming from natural causes is insignificant, and has been ruled out with a high degree of certainty
Natural causes have NOT been ruled out. TSI may or may not be sufficient, but there are other possibilities including PDO/AMO. TSI is one possible driver of the PDO/AMO cycle, but there are other possibilities. They really don't know for sure, but that there is a 60 year cycle of PDO/AMO is not in doubt.
Climate models have assumed that human source CO2 is responsible and natural causes have not been sufficiently modeled or taken into account. This remains a point of contention.
3. Climate sensitivity is high, or at least high to cause the following...
Without moderate to high climate sensitivity, all of this is moot.
4. The warming is causing feedbacks in the climate system which will lead to a multiple of the beginning warming
So far, the feedbacks are not showing up. That's why the model projections have been consistently WRONG for 20 years running. Again, if the feedbacks are not occurring, then CO2 increase is not important.
5. The amount of warming will actually cause most of the disaster scenarios presented
If ALL of the above conditions aren't met, then the disasters will not occur, and this is all a colossal waste of time and money.
[This message has been edited by fierobear (edited 12-21-2012).]
Look how the land temp is so dramatically less impacted than the water temps. Yet we on the land are supposed to be causing Global Warming?
The oceans make up 75% of the surface of the earth. They absorb most of the sun's rays. They produce all of the plankton which gives off gases. They also produce most of the cloud cover which holds heat but also shields the earth. In short, the puny influence of mankind is pretty small against those factors. And we are talking about people generating .06% of the green house gases in total. Talk about claiming the tail is wagging the dog.