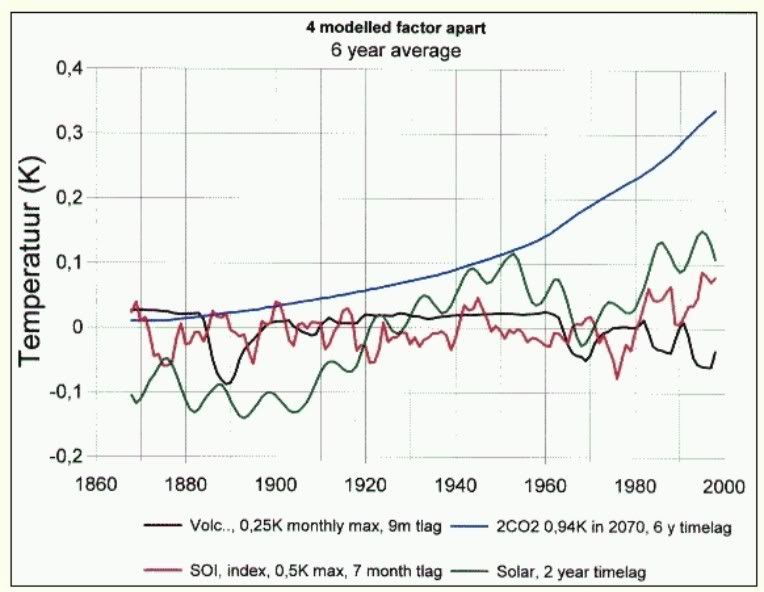
Originally posted by fierobear: Let me know if you'd like the sources for those. Note that solar forcing has a time lag. It would seem to agree with the theory I've recently read that the oceans, rather than greenhouse gasses, drive temperature. Also, the oceans change their temperature VERY slowly, so a lag of several years makes sense with a sun-ocean-driven climate system.
I don't know what went into the model you posted, and I can't find a reference study. Is it possible they included GG's without your knowledge?
From the same site:
Looks like solar + green house gases correspond to a 92% correlation?
Actually, you've misinterpreted the graph. The 92% correlation is sun + GHG. GHG alone has a 51% correlation, sun alone has a 71% correlation. That's a MUCH stronger sun correlation than GHG. With a higher sun correlation, you could make a good point that GHG is more coincidental than a forcing.
[This message has been edited by fierobear (edited 08-05-2008).]
Who is "they"? Is there a link or (presumably leftist/commy) news article that backs this up?
They is the AGW crowd. The article was in an issue of Time Magazine last fall. The article actually specifically lambasted the AGW proponents for their hurricane predictions that didn't come true, which they then also blamed on AGW. It was actually about how they are having it both ways. Surprising for Time, actually...
Originally posted by fierobear: Actually, you've misinterpreted the graph. The 92% correlation is sun + GHG. GHG alone has a 51% correlation, sun alone has a 71% correlation. That's a MUCH stronger sun correlation than GHG. With a higher sun correlation, you could make a good point that GHG is more coincidental than a forcing.
Did I say GG's caused 100% of GW? No. Are they a contributing cause? Clearly. That's my point. I think that's everyone's point. Global warming is a natural phenomenon, just like global cooling. However, the evidence points to GG's increasing the global warming beyond where they would naturally be. (See your graph, and mine.)
It's hard to argue with a 92% correlation when the sun alone has less correlation. 0.7 or 0.5 correlation is not anything to get excited about. Various correlation coefficients:
0.92 is a much stronger case than 0.7 or 0.5. BTW, if greenhouse gases were NOT related to global warming, they'd have a correlation coefficient of 0.... or maybe 0.1.
[This message has been edited by ryan.hess (edited 08-05-2008).]
It is, at best, weak evidence, I farted, and at the same second 2 people in the world died..... Does it mean that my farts are killing people?? (Seriously )
There is still a good chance that any climate trend is actually being caused by something we haven't found yet....
I didn't mean to imply that you had, only that you seemed to be reading the percentages incorrectly.
quote
No. Are they a contributing cause? Clearly. That's my point. I think that's everyone's point. Global warming is a natural phenomenon, just like global cooling. However, the evidence points to GG's increasing the global warming beyond where they would naturally be. (See your graph, and mine.)
It is quite possible that manmade GHGs are contributing to a rise in temperatures, but there is just as much evidence (or lack of proof) to suggest that the amount is insignificant. It's like peeing in the ocean. Will it contribute to a rise in sea level? Yes. Is it significant or anything to be concerned about? No.
quote
It's hard to argue with a 92% correlation when the sun alone has less correlation. 0.7 or 0.5 correlation is not anything to get excited about. Various correlation coefficients:
I'm sorry, your graphic is too small to read.
It is important to point out that correlation is not causation. That CO2 and temperatures have risen together, more or less, in the last century is clear. That CO2 is causing that rise, or at least any significant amount, cannot be taken as fact. To put some historical perspective on it, look through Earth's temperature/CO2 history. You'll find that at NO time, anywhere in Earth's history, has CO2 driven temperature. That should be taken into account when deciding whether CO2 is driving temperatures now, or it's just a coincidence that they are rising (even in the loosest sense) right now. To further drive home that point, you'll find that, historically, CO2 follows temperature rise. From a scientific point of view, it should have been concluded that the same has been happening for the last century. At least that would be the logical, non-emotional conclusion.
Look again at my graph with CO2, temperature and sun. You'll find CO2 continues up, but temperature does not. There is a noticeable disconnect. That should be taken into account.
Nor does it imply cause and effect. A statistical correlation on one measure does not necessarily mean anything which is why science is always looking for multiple sources of data from different disciplines to be able to imply a causal relationship.
Here's some good news. It looks like the American public really isn't buying into this bullshit afterall..
Only 25 Percent See Global Warming Threat ABC poll finds few Americans see climate change as environment's biggest threat, more trust business than government to address problems.
By Nathan Burchfiel Business & Media Institute 8/11/2008 1:14:36 PM
In spite of the media�s obsession with global warming, only 25 percent of Americans view climate change as the world�s biggest environmental threat, according to a new ABC News poll. Fewer than half � 47 percent � viewed global warming as �extremely� or �very� important to them.
Those numbers and others from the poll don�t fit the common media theme that there is a scientific �consensus� on global warming: that it is caused by humans and will have catastrophic consequences.
Those poll numbers gave way to more media spin in an ABC �World News Saturday� report August 9.
�After years of debate over the reality of global warming, 80 percent of those polled now say they accept it as fact,� anchor Bill Weir reported. �Seventy-three percent say it is a threat to today�s children and 63 percent believe people and industry are to blame.�
But Weir didn�t mention that while 80 percent of Americans believe global warming is occurring, they see much more nuanced debate over the causes and potential effects. While the media have tried to silence debate on global warming � as the Business & Media Institute showed in its report, �Global Warming Censored� � the American people understand there is still not a consensus.
Sixty-three percent said there is �a lot of disagreement among scientists� on the causes of global warming. Only 33 percent of respondents said they think �things people do� are mostly responsible for climate change, down from 41 percent in April 2007.
The media offer catastrophic predictions on the effects of global warming on everything from floods to fires to the cute and cuddly polar bears. Even with the media ignoring the debate, 62 percent of Americans realize scientists disagree on how serious a threat climate change actually poses.
And even though the media tend to run to the government for fixes to global warming problems, Americans seem have more faith in markets. Forty-three percent said the government would do a better job reducing warming, while 45 percent said businesses are better equipped to address the problem through market-based competition.
Support for government programs aimed at reducing carbon emissions might be lower if the media reported the severe cost of legislative proposals like the failed Lieberman-Warner bill. That legislation would have established a carbon cap-and-trade system. According to some estimates, it would have cost every man, woman and child nearly $500 a year.
The poll results suggested the media have some work to do to build its own credibility. Only 38 percent of respondents said �most� or �all� of written and broadcast news is accurate.
The media are hyping global warming now, but in the past 100 years of coverage on �climate change� issues, they have flip-flopped between cooling and warming dangers several times. The Business & Media Institute�s special report, �Fire and Ice,� showed that as recently as 30 years ago, the media warned of a coming ice age.
Only 25 Percent See Global Warming Threat ABC poll finds few Americans see climate change as environment's biggest threat, more trust business than government to address problems.
By Nathan Burchfiel Business & Media Institute 8/11/2008 1:14:36 PM
...snip...
The media are hyping global warming now, but in the past 100 years of coverage on �climate change� issues, they have flip-flopped between cooling and warming dangers several times. The Business & Media Institute�s special report, �Fire and Ice,� showed that as recently as 30 years ago, the media warned of a coming ice age.
Just quoting the last line of the artcile Fierobear posted-
But INDEED- Articles in the mid 70's predicted famine and such by the mid 1980's due to "global cooling" and the crop failures that would result from it...Seems as though that cooling never happened, LOL.
[This message has been edited by FieroFanatic13 (edited 08-12-2008).]
That whole business from the movie Day After Tomorrow, slowly warming and then bam, Ice Age, how did that all come about, simply hollywood?
The concept that "warming could" cause an ice age has some science to it, but not in the time frame they used in that movie. It would take a LONG time for that to happen IF it happened at all. The basic tenant being that warming might cause melting of freshwater ice that would in turn dilute the North Atlantic and slow the North Atlantic Current, thus slowing that current that carries much of the heat from the tropics to the Northern Hemisphere. This is turn could lead to cooling in the Northern Hemisphere. That is the idea they were playing off of, but they went crazy with it to say the least. Horrible "bad science" movie.
Speaking of that movie, I just loved that "super freeze" thing they did- That was just ridiculous and had no REAL scientific basis to it. They were going with some silly sudden atmospheric drop to the surface (cold upper atmospheric air dropping to the surface basically instantly) to account for their little "insta freeze." See Phranc's post below- they went with super storms that were so large they pulled air down...
[This message has been edited by FieroFanatic13 (edited 08-12-2008).]
For today's installment of "AGW is bullshit", let's take note how wrong they are about the predicted Arctic ice melt for this summer. They said the pole would be ice free. Ooops.
Just a few weeks ago, predictions of Arctic ice collapse were buzzing all over the internet. Some scientists were predicting that the "North Pole may be ice-free for first time this summer". Others predicted that the entire "polar ice cap would disappear this summer".
The Arctic melt season is nearly done for this year. The sun is now very low above the horizon and will set for the winter at the North Pole in five weeks. And none of these dire predictions have come to pass. Yet there is, however, something odd going on with the ice data.
The National Snow and Ice Data Center (NSIDC) in Boulder, Colorado released an alarming graph on August 11, showing that Arctic ice was rapidly disappearing, back towards last year's record minimum. Their data shows Arctic sea ice extent only 10 per cent greater than this date in 2007, and the second lowest on record. Here's a smaller version of the graph: Arctic ice not disappearing (SEE THE LINK FOR THE GRAPH)
The National Snow and Ice Data Center (NSIDC)'s troublesome ice graph
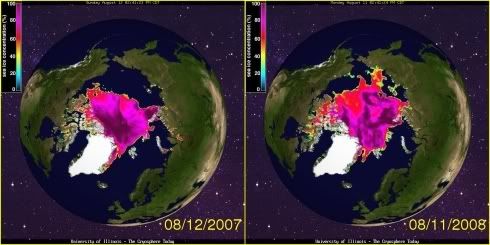
The problem is that this graph does not appear to be correct. Other data sources show Arctic ice having made a nice recovery this summer. NASA Marshall Space Flight Center data shows 2008 ice nearly identical to 2002, 2005 and 2006. Maps of Arctic ice extent are readily available from several sources, including the University of Illinois, which keeps a daily archive for the last 30 years. A comparison of these maps (derived from NSIDC data) below shows that Arctic ice extent was 30 per cent greater on August 11, 2008 than it was on the August 12, 2007. (2008 is a leap year, so the dates are offset by one.) Ice at the Arctic
Ice at the Arctic: 2007 and 2008 snapshots
The video below highlights the differences between those two dates. As you can see, ice has grown in nearly every direction since last summer - with a large increase in the area north of Siberia. Also note that the area around the Northwest Passage (west of Greenland) has seen a significant increase in ice. Some of the islands in the Canadian Archipelago are surrounded by more ice than they were during the summer of 1980.
The 30 per cent increase was calculated by counting pixels which contain colors representing ice. This is a conservative calculation, because of the map projection used. As the ice expands away from the pole, each new pixel represents a larger area - so the net effect is that the calculated 30 per cent increase is actually on the low side.
So how did NSIDC calculate a 10 per cent increase over 2007? Their graph appears to disagree with the maps by a factor of three (10 per cent vs. 30 per cent) - hardly a trivial discrepancy. What melts the Arctic?
The Arctic did not experience the meltdowns forecast by NSIDC and the Norwegian Polar Year Secretariat. It didn't even come close. Additionally, some current graphs and press releases from NSIDC seem less than conservative. There appears to be a consistent pattern of overstatement related to Arctic ice loss.
We know that Arctic summer ice extent is largely determined by variable oceanic and atmospheric currents such as the Arctic Oscillation. NASA claimed last summer that "not all the large changes seen in Arctic climate in recent years are a result of long-term trends associated with global warming". The media tendency to knee-jerkingly blame everything on "global warming" makes for an easy story - but it is not based on solid science. � Bootnote
And what of the Antarctic? Down south, ice extent is well ahead of the recent average. Why isn't NSIDC making similarly high-profile press releases about the increase in Antarctic ice over the last 30 years?
The author, Steven Goddard, is not affiliated directly or indirectly with any energy industry, nor does he have any current affiliation with any university.
The author, Steven Goddard, is not affiliated directly or indirectly with any energy industry, nor does he have any current affiliation with any university.
The author, Steven Goddard, is not affiliated directly or indirectly with any energy industry, nor does he have any current affiliation with any university.
Did I say GG's caused 100% of GW? No. Are they a contributing cause? Clearly. That's my point. I think that's everyone's point. Global warming is a natural phenomenon, just like global cooling. However, the evidence points to GG's increasing the global warming beyond where they would naturally be. (See your graph, and mine.)
It's hard to argue with a 92% correlation when the sun alone has less correlation. 0.7 or 0.5 correlation is not anything to get excited about. Various correlation coefficients:
0.92 is a much stronger case than 0.7 or 0.5. BTW, if greenhouse gases were NOT related to global warming, they'd have a correlation coefficient of 0.... or maybe 0.1.
Ryan you have it exactly backwards. The reason GG correlates to Global Temperature is that Sunspot activity increases the earth's mean temperature and therefore plant life growth rates are boosted. The GG's follow the increase or decrease of the output of the Sun. Remember that the last iceage was caused by the virtual disappearance of Sunspots for an extended period of time. You will find that the delay in the Sunspot cycle last fall contributed to a cooler winter and still contributes to a cooler summer.
There is no science that shows that GG's lead the Sun's output. It is the other way around. The Sun's output affects many things including mean temperature, weather cycles and ocean currents. While you can argue man's influence on GG's, you can't argue man's influence on the Sun. Moreover, the percentage of man's influence on the GG's is less than 1% more along the line of .06% with nitrogen content being the lion's share of atmospheric content. Even the water vapour content affects the sun's rays. This is the reason the ground and air cool off under a cloudy day.
It is pretty hard for amateurs (like most of us here) to interpret scientific data. It is particularly difficult to determine cause and effect, and scientists are still arguing that one. One thing is certain though, the clear majority of scientists, while acknowleging Global Warming phenomenon, do not endorse Al Gore or his propaganda.
Originally posted by ryan.hess: Did I say GG's caused 100% of GW? No. Are they a contributing cause? Clearly. That's my point. I think that's everyone's point. Global warming is a natural phenomenon, just like global cooling. However, the evidence points to GG's increasing the global warming beyond where they would naturally be. (See your graph, and mine.)
It's hard to argue with a 92% correlation when the sun alone has less correlation. 0.7 or 0.5 correlation is not anything to get excited about. Various correlation coefficients:
0.92 is a much stronger case than 0.7 or 0.5. BTW, if greenhouse gases were NOT related to global warming, they'd have a correlation coefficient of 0.... or maybe 0.1.
Obviously you've never really studied statistics. Or maybe you have and just didn't get the MOST important principle for anyone who is honest about statistics.
That's what it's come down to, I'm afraid. The AGW crowd's first line of defense against contrary evidence to their religion is to drop the line "funded by Exxon/Mobil".
That's what it's come down to, I'm afraid. The AGW crowd's first line of defense against contrary evidence to their religion is to drop the line "funded by Exxon/Mobil".
Just yesterday I was telling a warmist that the IPCC study was flawed. He said prove it so I flooded him with links proving it. All he did was attack the sources and claim it was neo-con BS and pointed out one guy who was obviously a liar because he worked for coal at some point. I then countered with the links about funding and how the warmists for folds more funding and how the skeptics don't get much at all. Then he stated attacking me. Not once did he attack of even acknowledge the substance against the warmist claims.
Just yesterday I was telling a warmist that the IPCC study was flawed. He said prove it so I flooded him with links proving it. All he did was attack the sources and claim it was neo-con BS and pointed out one guy who was obviously a liar because he worked for coal at some point. I then countered with the links about funding and how the warmists for folds more funding and how the skeptics don't get much at all. Then he stated attacking me. Not once did he attack of even acknowledge the substance against the warmist claims.
whats funny is that I had an *actual* debate with someone about global warming just yesterday, and HE used to work for a coal company!!
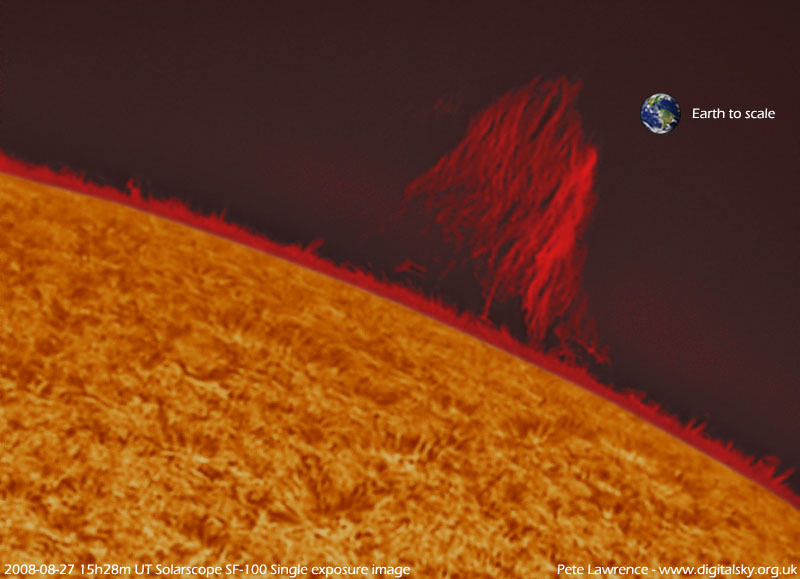
"Drop in solar activity has potential effect for climate on earth.
The sun has reached a milestone not seen for nearly 100 years: an entire month has passed without a single visible sunspot being noted.
The event is significant as many climatologists now believe solar magnetic activity � which determines the number of sunspots -- is an influencing factor for climate on earth.
According to data from Mount Wilson Observatory, UCLA, more than an entire month has passed without a spot. The last time such an event occurred was June of 1913. Sunspot data has been collected since 1749.
When the sun is active, it's not uncommon to see sunspot numbers of 100 or more in a single month. Every 11 years, activity slows, and numbers briefly drop to near-zero. Normally sunspots return very quickly, as a new cycle begins.
But this year -- which corresponds to the start of Solar Cycle 24 -- has been extraordinarily long and quiet, with the first seven months averaging a sunspot number of only 3. August followed with none at all. The astonishing rapid drop of the past year has defied predictions, and caught nearly all astronomers by surprise.
In 2005, a pair of astronomers from the National Solar Observatory (NSO) in Tucson attempted to publish a paper in the journal Science. The pair looked at minute spectroscopic and magnetic changes in the sun. By extrapolating forward, they reached the startling result that, within 10 years, sunspots would vanish entirely. At the time, the sun was very active. Most of their peers laughed at what they considered an unsubstantiated conclusion.
The journal ultimately rejected the paper as being too controversial.
The paper's lead author, William Livingston, tells DailyTech that, while the refusal may have been justified at the time, recent data fits his theory well. He says he will be "secretly pleased" if his predictions come to pass.
But will the rest of us? In the past 1000 years, three previous such events -- the Dalton, Maunder, and Sp�rer Minimums, have all led to rapid cooling. One was large enough to be called a "mini ice age". For a society dependent on agriculture, cold is more damaging than heat. The growing season shortens, yields drop, and the occurrence of crop-destroying frosts increases.
Meteorologist Anthony Watts, who runs a climate data auditing site, tells DailyTech the sunspot numbers are another indication the "sun's dynamo" is idling. According to Watts, the effect of sunspots on TSI (total solar irradiance) is negligible, but the reduction in the solar magnetosphere affects cloud formation here on Earth, which in turn modulates climate.
This theory was originally proposed by physicist Henrik Svensmark, who has published a number of scientific papers on the subject. Last year Svensmark's "SKY" experiment claimed to have proven that galactic cosmic rays -- which the sun's magnetic field partially shields the Earth from -- increase the formation of molecular clusters that promote cloud growth. Svensmark, who recently published a book on the theory, says the relationship is a larger factor in climate change than greenhouse gases.
Solar physicist Ilya Usoskin of the University of Oulu, Finland, tells DailyTech the correlation between cosmic rays and terrestrial cloud cover is more complex than "more rays equals more clouds". Usoskin, who notes the sun has been more active since 1940 than at any point in the past 11 centuries, says the effects are most important at certain latitudes and altitudes which control climate. He says the relationship needs more study before we can understand it fully.
Other researchers have proposed solar effects on other terrestrial processes besides cloud formation. The sunspot cycle has strong effects on irradiance in certain wavelengths such as the far ultraviolet, which affects ozone production. Natural production of isotopes such as C-14 is also tied to solar activity. The overall effects on climate are still poorly understood.
What is incontrovertible, though, is that ice ages have occurred before. And no scientist, even the most skeptical, is prepared to say it won't happen again.
Article Update, Sep 1 2008. After this story was published, the NOAA reversed their previous decision on a tiny speck seen Aug 21, which gives their version of the August data a half-point. Other observation centers such as Mount Wilson Observatory are still reporting a spotless month. So depending on which center you believe, August was a record for either a full century, or only 50 years.
Like I said when Gore started spouting his BS, Its the NATURAL chain of events now as it has been for 5 billion years. Temps are controlled by (bugles) the SUN. As it does whatever it does, so the earth reacts. It will always do that until the sun dies or explodes. Nothing we do here has any but a miniscule effect on the planet. I doubt if we could even pump out enough ammonia into the atmospere to affect anything if we even tried.
Foreword: Don J. Easterbrook sent me this essay on Friday for publication here, but with the dustup over Monckton�s paper and the APS, I decided to hold off publishing it for a bit. For background, see Easterbrook�s web page here. - Anthony
Shifting of the Pacific Decadal Oscillation from its warm mode to cool mode assures global cooling for the next three decades.
Don J. Easterbrook, Dept. of Geology, Western Washington University, Bellingham, WA
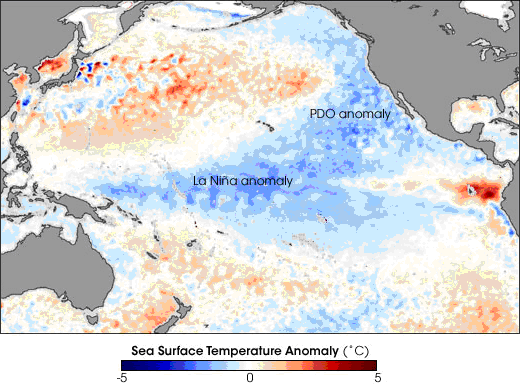
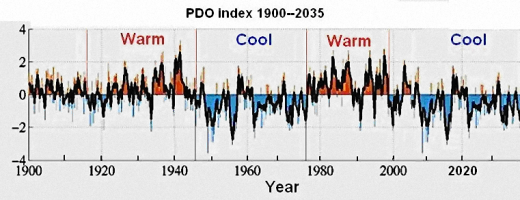
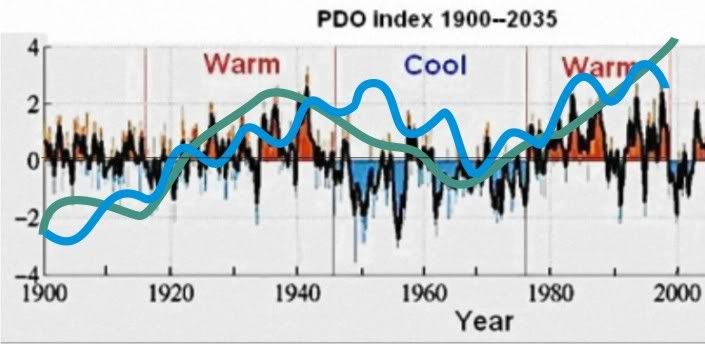
Addressing the Washington Policymakers in Seattle, WA, Dr. Don Easterbrook said that shifting of the Pacific Decadal Oscillation (PDO) from its warm mode to its cool mode virtually assures global cooling for the next 25-30 years and means that the global warming of the past 30 years is over. The announcement by NASA that the (PDO) had shifted from its warm mode to its cool mode (Fig. 1) is right on schedule as predicted by past climate and PDO changes (Easterbrook, 2001, 2006, 2007) and is not an oddity superimposed upon and masking the predicted severe warming by the IPCC. This has significant implications for the future and indicates that the IPCC climate models were wrong in their prediction of global temperatures soaring 1�F per decade for the rest of the century.
Figure 1. Cooling of the Pacific Ocean and setting up of the cool-mode PDO. Sea surface temperature anomaly in the Pacific Ocean from April 14-21, 2008. The anomaly compares the recent temperatures measured by the Advanced Microwave Scanning Radiometer for EOS (AMSR-E) on NASA�s Aqua satellite with an average of data collected by the NOAA Pathfinder satellites from 1985-1997. Places where the Pacific was cooler than normal are blue, places where temperatures were average are white, and places where the ocean was warmer than normal are red. The cool water anomaly in the center of the image shows the lingering effect of the year-old La Ni�a. However, the much broader area of cooler-than-average water off the coast of North America from Alaska (top center) to the equator is a classic feature of the cool phase of the Pacific Decadal Oscillation (PDO). The cool waters wrap in a horseshoe shape around a core of warmer-than-average water. (In the warm phase, the pattern is reversed). Unlike El Ni�o and La Ni�a, which may occur every 3 to 7 years and last from 6 to 18 months, the PDO can remain in the same phase for 20 to 30 years. (NASA image by Jesse Allen, AMSR-E data processed and provided by Chelle Gentemann and Frank Wentz, Remote Sensing Systems. Caption by Rebecca Lindsey, adapted from a press release from NASA JPL).
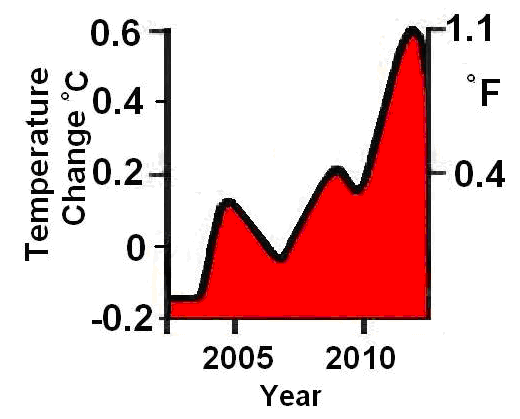
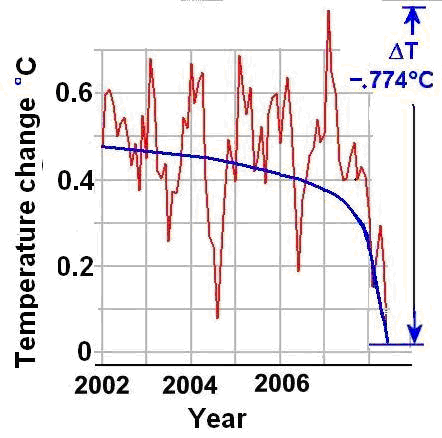
Instead of a rise of 1�F during the first decade of this century as predicted by IPCC climate models (Fig 2), global temperatures cooled slightly for the past nine years and cooled more than 1�F this year (Fig 3). Global cooling over the past decade appears to be due to a global cooling trend set up by the PDO cool mode and a similar shift in the Atlantic. The IPCC�s prediction of a 1� F warming by 2011, will require warming of about 1� F in the next three years and unless that happens, the IPCC models will be proven invalid.
Figure 2. IPCC predicted warming.
Figure 3. Measured cooling.
As shown by the historic pattern of PDOs over the past century (Fig. 4) and by corresponding global warming and cooling, the pattern is part of ongoing warm/cool cycles that last 25-30 years. Each time the PDO mode has shifted from warm to cool or cool to warm, the global climate has changed accordingly. In 1977, the PDO shifted from cool mode to warm mode (Fig. 4) and set off the global warming from 1977 to 1998, often referred to as the �Great Climate Shift.� The recent shift from PDO warm mode to cool mode is similar to the shift that occurred in the mid-1940�s and resulted in 30 years of global cooling (Fig. 4). The global warming from ~1915 to ~1945 was also brought on by a mode shift in the PDO (Fig. 4). Every indication points continuation of the PDO patterns of the past century and global cooling for the next 30 years (Fig. 4). Thus, the global warming the Earth has experienced since 1977 appears to be over!
Figure 4. PDO indices, 1900-2008 with predictions to 2040.
===================================
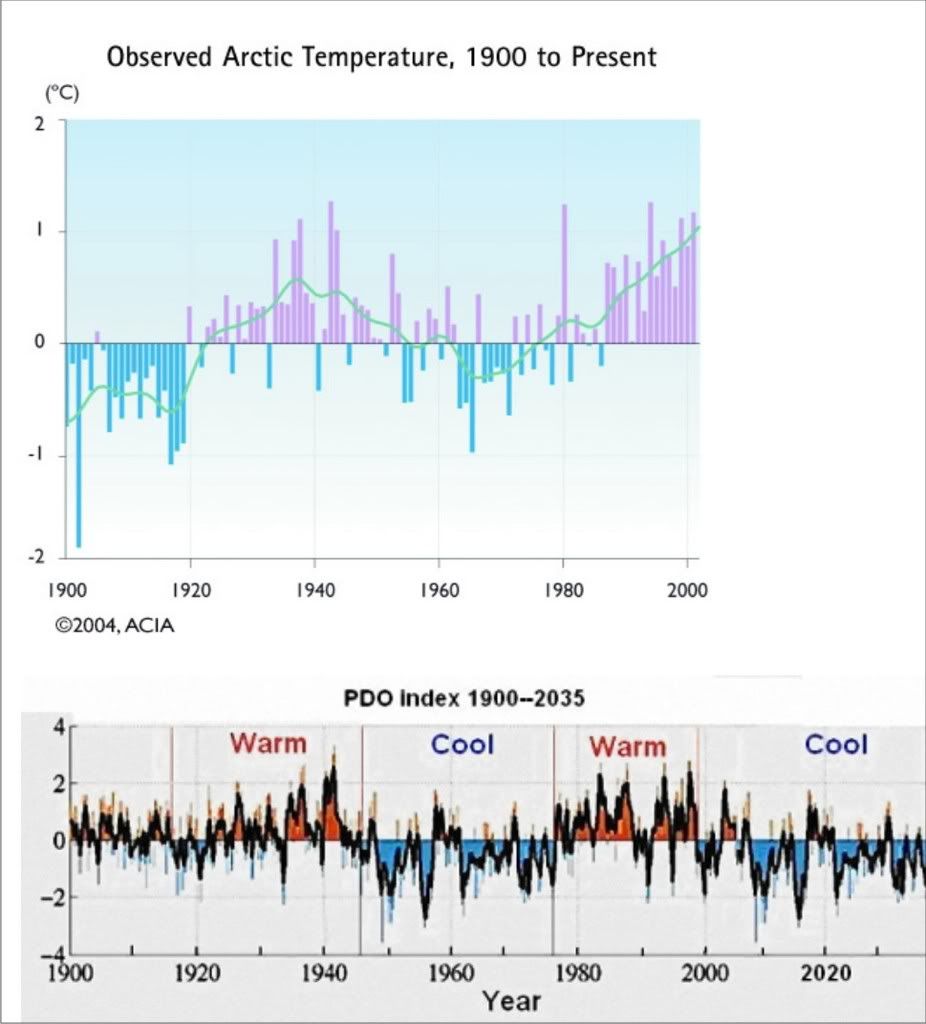
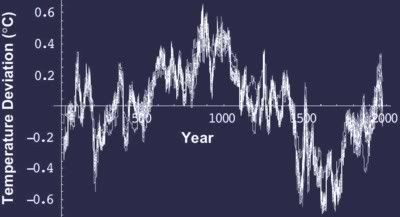
Compare the above graphic to the temperature history...
I put two graphs next to each other. Those peaks and troughs have some interesting similarity.
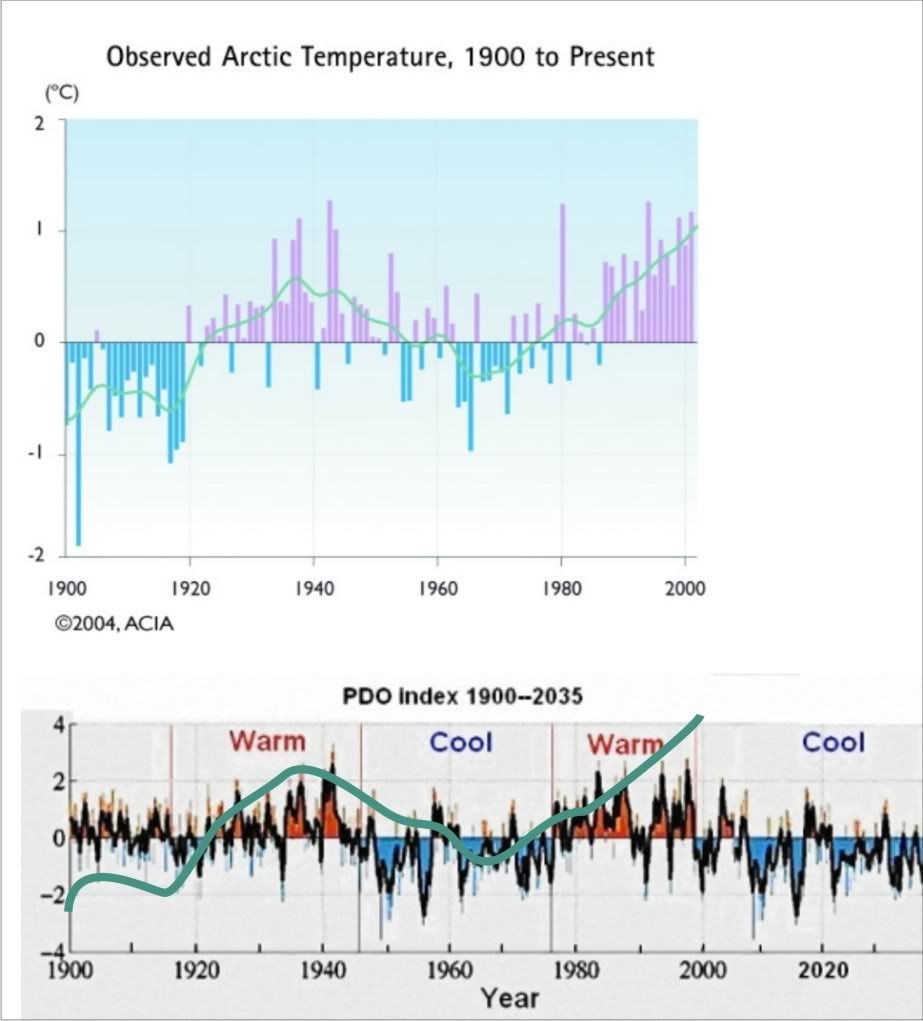
I traced the temperature line from the upper graph, and placed it over the lower graph. Interesting, huh?
. . So, what if the PDO was driving both temperature AND extra CO2 release from oceans, and the true correlation is PDO to temperature, and CO2 was a coincidence, like CO2 is everywhere else in history?
[This message has been edited by fierobear (edited 09-02-2008).]
� Geo-engineering 'better than doing nothing' � Fake clouds among ideas in Royal Society papers
Political inaction on global warming has become so dire that nations must now consider extreme technical solutions - such as blocking out the sun - to address catastrophic temperature rises, scientists from around the world warn today.
The experts say a reluctance "at virtually all levels" to address soaring greenhouse gas emissions means carbon dioxide levels in the atmosphere are on track to pass 650 parts-per-million (ppm), which could bring an average global temperature rise of 4C. They call for more research on geo-engineering options to cool the Earth, such as dumping massive quantities of iron into oceans to boost plankton growth, and seeding artificial clouds over oceans to reflect sunlight back into space.
Writing the introduction to a special collection of scientific papers on the subject, published today by the Royal Society, Brian Launder of the University of Manchester and Michael Thompson of the University of Cambridge say: "While such geoscale interventions may be risky, the time may well come when they are accepted as less risky than doing nothing."
They add: "There is increasingly the sense that governments are failing to come to grips with the urgency of setting in place measures that will assuredly lead to our planet reaching a safe equilibrium."
Professor Launder, a mechanical engineer, told the Guardian: "The carbon numbers just don't add up and we need to be looking at other options, namely geo-engineering, to give us time to let the world come to its senses." He said it was important to research and develop the technologies so that they could be deployed if necessary. "At the moment it's almost like talking about how we could stop world war two with an atomic bomb, but we haven't done the research to develop nuclear fission."
Such geo-engineering options have been talked about for years as a possible last-ditch attempt to control global temperatures, if efforts to constrain emissions fail. Critics argue they are a dangerous distraction from attempts to limit carbon pollution, and that they could have disastrous side-effects. They would also do nothing to prevent ecological damage caused by the growing acidification of the oceans, caused when carbon dioxide dissolves in seawater. Last year, the Intergovernmental Panel on Climate Change dismissed geo-engineering as "largely speculative and unproven and with the risk of unknown side-effects".
Dr Alice Bows of the Tyndall Centre for Climate Change Research at the University of Manchester said: "I'm not a huge fan of messing with the atmosphere in an geo-engineering sense because there could be unpredictable consequences. But there are also a lot of unpredictable consequences of temperature increase. It does appear that we're failing to act [on emissions]. And if we are failing to act, then we have to consider some of the other options."
In a strongly worded paper with colleague Kevin Anderson in today's special edition of the society's Philosophical Transactions journal, Bows says politicians have significantly underestimated the scale of the climate challenge. They say this year's G8 pledge to cut global emissions 50% by 2050, in an effort to limit global warming to 2C, has no scientific basis and could lead to "dangerously misguided" policies.
The scientists say global carbon emissions are rising so fast that they would need to peak by 2015 and then decrease by up to 6.5% each year for atmospheric CO2 levels to stabilise at 450ppm, which might limit temperature rise to 2C. Even a goal of 650ppm - way above most government projections - would need world emissions to peak in 2020 and then reduce 3% each year.
Globally, a 4C temperature rise would have a catastrophic impact. According to the government's Stern review on the economics of climate change in 2006, between 7 million and 300 million more people would be affected by coastal flooding each year, there would be a 30-50% reduction in water availability in southern Africa and the Mediterranean, agricultural yields would decline 15-35% in Africa and 20-50% of animal and plant species would face extinction.
Martin Rees, president of the Royal Society, said: "It's not clear which of these geo-engineering technologies might work, still less what environmental and social impacts they might have, or whether it could ever be prudent or politically acceptable to adopt any of them. But it is worth devoting effort to clarifying both the feasibility and any potential downsides of the various options. None of these technologies will provide a 'get out of jail free card' and they must not divert attention away from efforts to reduce emissions of greenhouse gases."
Mike Childs of Friends of the Earth said: "We can't afford to wait for magical geo-engineering solutions to get us out of the hole we have dug ourselves into. The solutions that exist now, such as a large-scale energy efficiency programme and investment in wind, wave and solar power, can do the job if we deploy them at the scale and urgency that is needed."
They do know that its been cooling for the last few years and warming right?Do these people even pay attention to the science anymore? Did they ever?
Why bother paying attention to the science, when the science seems to have it WRONG, and they are pushing for action NOW NOW NOW, regardless of any facts? This is no longer science. It's religion.
"Cooling in the pacific is going to cool the globe" - Some retired Geology professor
Well there you have it. Case closed!
It's strange how one side rails against using limited satellite measurements, "one point measurements" (e.g. arctic temp), and skewed graphs (hockey stick).......... and yet here we are again!
"Cooling in the pacific is going to cool the globe" - Some retired Geology professor
Actually, it's not just PDO. I suspect that's only one factory. The next piece of data I'm going to try to cross reference is solar. I suspect that solar cycles are driving the PDO.
As for the rest of this, I'd need to know what you are referencing (aside from the graph).
quote
It's strange how one side rails against using limited satellite measurements, "one point measurements" (e.g. arctic temp), and skewed graphs (hockey stick).......... and yet here we are again!
Oh no! We're gonna die!
But...isn't that what the warmists are saying, with the 1-4dC warming they're predicting?
So 2008 was cold. 2007 was warm. Looking at some monthly chart of temperature for the last 6 years is pointless for something that happens over decadal time frames. Yes, there very well might be a trend downward that has already started, in which case - we're probably too late. Time to get out the parka because the glaciers will be knocking on my door before you know it.
It looks like there were a couple recent spikes upward that your graph doesn't show. (not that it's particularly significant, but still interesting.)
It looks like there were a couple recent spikes upward that your graph doesn't show. (not that it's particularly significant, but still interesting.)
Your graph appears to be GISS data. There are questions about it, odd changes made to historical data, questions about the urban heat island effect on the data, and so on.
Following up on my last post, I've added solar data to the PDO graph:
Craig Loehle paper on a 2000 year temperature reconstruction without using treering proxies. Those proxies are now considered as possibly unreliable. It would seem that Mann agrees, given that his new "hockey stick" eliminates them, or at least, there is an effort to prove temperature history without them.
Abstract Loehle, C. 2007. A 2000-year global temperature reconstruction based on non-treering proxies. Energy & Environment 18(7-8): 1049-1058. Note: Figure 1 data are available in a CSV file.
Loehle, C., and J.H. McCulloch. 2008. Correction to: A 2000-year global temperature reconstruction based on non-treering proxies. Energy & Environment 19(1): 93-100. Note: Supplemental data are available in a ZIP file.
Historical data provide a baseline for judging how anomalous recent temperature changes are and for assessing the degree to which organisms are likely to be adversely affected by current or future warming. Climate histories are commonly reconstructed from a variety of sources, including ice cores, tree rings, and sediment. Tree-ring data, being the most abundant for recent centuries, tend to dominate reconstructions. There are reasons to believe that tree ring data may not properly capture long-term climate changes. In this study, eighteen 2000-year-long series were obtained that were not based on tree ring data. Data in each series were smoothed with a 30-year running mean. All data were then converted to anomalies by subtracting the mean of each series from that series. The overall mean series was then computed by simple averaging. The mean time series shows quite coherent structure. The mean series shows the Medieval Warm Period (MWP) and Little Ice Age (LIA) quite clearly, with the MWP being approximately 0.3�C warmer than 20th century values at these eighteen sites.
Key graph, showing current temperatures and the medieval warm period (which Mann seems desperate to eliminate)
[This message has been edited by fierobear (edited 09-05-2008).]
Following a record rate of ice loss through the month of August, Arctic sea ice extent already stands as the second-lowest on record, further reinforcing conclusions that the Arctic sea ice cover is in a long-term state of decline. With approximately two weeks left in the melt season, the possibility of setting a new record annual minimum in September remains open.
....
In a typical year, the daily rate of ice loss starts to slow in August as the Arctic begins to cool. By contrast, in August 2008, the daily decline rate remained steadily downward and strong.
The average daily ice loss rate for August 2008 was 78,000 square kilometers per day (30,000 square miles per day). This is the fastest rate of daily ice loss that scientists have ever observed during a single August. Losses were 15,000 square kilometers per day (5,800 square miles per day) faster than in August 2007, and 27,000 square kilometers per day (10,000 square miles per day) faster than average.
what's that, I can't read it? Some kind of temperature graph? What are you hiding?
That's a photo of ice coverage of the arctic. Sure seems at odds with what you posted. Oh, and I'm pretty sure that photo is from the NSIDC, same source as yours. I just can't find the source page.
what's that, I can't read it? Some kind of temperature graph? What are you hiding?
Scroll up to the first time it was posted. If that is to much for you I can tell you it is a satellite composite of the actual ice cover over the Arctic from last month and the same month from the year before. More ice then last year. Last year was a record low. Last year they said this year would have no ice. This year had more ice.
I'm not hiding anything. I'm not sure what was hard about reading it. They make magnifying glassed just for computer screens. You can find them in those catalogs for old people. The kind with teatree soap and nose hair clippers and bunion cures. :P
[This message has been edited by Phranc (edited 09-05-2008).]


 )
)