Originally posted by Arns85GT: It is absolutely true that the ice pack in the Arctic receded and reached a low point in 2012. It has since been gaining ground every year.
Here’s a nice graphic depicting what’s known around here as “Arn’s recovery”
quote
Originally posted by MadMark: And now you are going to say that the oceans are warming.
Get a life and quit listening to the fear mongers.
While surfing google news I ran across a nasa visualization in the science section. It's a 2006 time lapse simulation depicting co2 generation. I have absolutely no idea what it has to do with climate change but I watched it twice. I think that it is one more example of science increasing it's understanding of a very complex system.
[This message has been edited by dratts (edited 11-18-2014).]
Originally posted by Arns85GT: Still scaremongering eh? The historical data doesn't support your propoganda
You should be ashamed of yourself for the flat out lies you constantly try to spread.
You have no scientific leg to stand on, nothing to even lean on. The only thing that keeps your argument afloat is ignorance, willful at times.
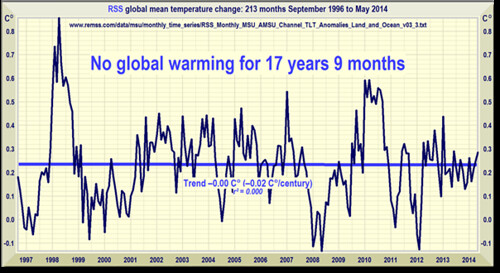
The graph you keep posting is only atmospheric temperatures and a cherry picked time period. Atmospheric temperatures only contain 2.3% of the warming. You're ignoring the overwhelming majority of evidence, oceans: Source.
[This message has been edited by FlyinFieros (edited 11-19-2014).]
Quoting Skeptical Science again eh? Talking about lies, how about the hockey stick graph? It does not come even close to the temperature record since it was created.
If the ocean is so much warmer, why do we still have all that Arctic ice? Or how about even more Antarctic ice?
Or how about the dramatic ocean level rise that was forecasted? The average is still only 0.34 in. per century.
Or how about the inundation of islands? Like the Maldives, or Manhattan?
Or how about the millions of climate refugees?
Or how about all those devastating hurricanes?
Why don't you tell the members in Buffalo about Global Warming?
The recent and current expansion of sea ice around Antarctica is being analyzed by climate researchers using data from paleoclimatology and computer models of southern ocean circulation.
It is not necessarily an indication that global warming has slowed, or any reassurance that global warming is not about to reassert itself more boisterously in the near future, as heat currently sequestered in the oceans is transferred to air masses over land areas, causing humans to more directly "feel the heat".
Quite the opposite, according to these researchers:
Originally posted by avengador1: Scientist Confesses: "Global Warming a $22 Billion Scam"
What a joke.
The guy claims all the scientists got it 180° wrong and are just ‘scaremongering’ for taxpayer money. In the next breath, he pitches his own scaremongering tactics for his own “End of Earth” disaster scenario. Let me guess, he wants money? This guy is a scammer.
[This message has been edited by FlyinFieros (edited 11-20-2014).]
Originally posted by Doug85GT: Where the journey ends for the AGW alarmists
Logically flawed.
You claim we’re better off ‘slitting children’s throats’ than acknowledging the impact humans have on the environment.
Yet the logic you use to justify ‘slitting children’s throats’ is the impact humans have on the environment.
He’s got a point though, if deniers like you just murder all the children we don’t have to worry about what kind of planet we leave behind for them. So circular. So logic. So psychopath.
Originally posted by Arns85GT: Quoting Skeptical Science again eh?
Yep.
Still quoting no one and spreading lies again eh?
quote
Originally posted by Arns85GT: Talking about lies, how about the hockey stick graph? It does not come even close to the temperature record since it was created.
Lies! The temperature record IS the “hockey stick” part you hate so much.
You claim we’re better off ‘slitting children’s throats’ than acknowledging the impact humans have on the environment.
Yet the logic you use to justify ‘slitting children’s throats’ is the impact humans have on the environment.
He’s got a point though, if deniers like you just murder all the children we don’t have to worry about what kind of planet we leave behind for them. So circular. So logic. So psychopath.
Originally posted by Doug85GT: "A funny thing happened on the way to global warming"
His first funny thing is "the warming stopped" myth. I stopped watching there. No need to give my time and attention to some biased denialist crank that ignores 90% of the evidence.
I have a hard time believing that the deniers here are anti science. We do believe in science don't we? If the science on climate change has errors they will be found. Science always questions itself and readjusts itself when new evidence is found. Climate being such a huge topic with so many variables I expect adjustments to be made in the future, but I would be surprised if there were a 180 degree change in direction. Unless science changes course it seems to me that the question should be, what do we do about it? Personally I would like to see the discussion head in this direction. Hard to do I know, if one just completely refuses to admit that there is a problem. I just want to weigh the facts as I know them and they present themselves through science. I do understand that there are vested interests that will twist things as much as possible and we are all subject to their influence. It seems likely that the vested interests are the hugely profitable industries that do not want to change doing those things that put money in their pockets. There is so much momentum in the direction that we are heading now that it will be painful and hard to change. That's why we need as much information as we can get. It could be just as catastrophic if we make the wrong choices. As in all things we only have a limited amount of resources to spend and it's imperative that we use them wisely and don't squander. As usual my train of thought just meanders all over the place. Hope there's something here that is helpful for those of us struggling with the topic. I posted a while back inquiring if anyone at all had changed their mind after following this thread and there was only one person who responded that they had. Everyone else seems to be rock hard in their opinions.
I like to hear all sides of an issue but I'm unwilling to watch an hour and a half of videos. If someone could summarize them for me that would be great.
[This message has been edited by dratts (edited 11-22-2014).]
I like to hear all sides of an issue but I'm unwilling to watch an hour and a half of videos. If someone could summarize them for me that would be great.
Massive. . . and I mean massive misrepresentations, misunderstandings, and red herring arguments.
Originally posted by Doug85GT: State what his arguments are then.
Bob Tisdale? Seriously?
His "argument" is El Nino creates energy and La Nina destroys energy.
That violates the first law of thermodynamics. Where does he think the energy comes from? Earth's climate system is still gaining energy. More energy is staying then leaving. His entire theory falls completely apart with the fact alone. There's also a long series of posts at Skeptical Science where Tisdale attempts to pitch his laughable theory and gets totally wrecked.
There are many hilarious comments left by Tisdale, but here's my favorite:
quote
Bob Tisdale: Are you aware that the global oceans can be divided into logical subsets which show the ocean heat content warmed naturally?
Composer99: No, they can't. Ocean heat has to come from somewhere.
Bob Tisdale: Apparently you have never divided OHC data into subsets, because if you had, you would not make such a statement. Dividing the oceans into subsets shows the ocean heat comes from somewhere, but it’s not CO2.
That is literally laugh out loud hilarious!
What are Tisdale's qualifications again?
[This message has been edited by FlyinFieros (edited 11-24-2014).]
Accused of being “flat Earth deniers of settled science” requires placing the Ptolemaic Model in perspective. Discussed for two centuries by the Greeks, Aristotle in 400 BC gave a solution involving approximately 50 transparent concentric spheres which rotated to provide the movements of planets and stars observed on a fixed, flat Earth. The fact that mathematical formulas provided some accuracy on the beginning and end of planet retrograde motions gave some empirical proof of concept. The fact that NO empirical evidence points of Carbon climate forcing has not bothered the “settled” scientists, which we will examine. In 1543 Copernicus proposed a circular orbit, heliocentric solar system, but by 1609, Kepler had proven the elliptical orbit model. Galileo’s discovery of moons around Jupiter in 1610 ended the useful period of ‘Flat Earth Center of the Universe’ Ptolemaic Model. For two thousand years humans believed a false model, with some mathematical support, but their “beliefs” did not a lter reality. Greenhouse gas belief does not alter reality either, as we will soon prove.
Accurate analysis of the movements of our solar system was more than an esoteric effort, as this knowledge proved the existence, and behavior of forces far beyond human production or easy measurement. In addition, accurate celestial mapping improved navigation. One method to study the Sun’s inputs to Earth’s climate, is to study the Moon, which is the same distance from the Sun. There are a number of important differences including no atmosphere, no oceans, no magnetic field, no volcanoes and longer rotation period, variables which we will examine. Earth’s atmosphere and oceans are energy buffering systems, and not energy inputs. The Earth has two inputs, solar energy and internal fission energy. The Moon has no volcanic activity and no evidence of any internal fission heating source, so only solar energy. The Moon rotates with the same side facing Earth giving a 14 Earth day long Sun and darkness cycle. With no atmosphere and no oceans, Earth conditions would approach Lunar temperatures, except the faster rotation making slight reductions in maximum highs and lows. Wiki lists Moon’s equatorial temperature range of 100K to 390K, although readers are cautioned to consider that published research indicates that sun’s radiant energy only penetrates 0.4 meters into the Lunar, refractory brick like surface [1]. The Lunar poles are a near constant 40°K, and the lowest temperature ever recorded in our solar system is the polar crater Hermite at 26°K. By comparison, Earth’s coldest temperature is 184°K and highest is 218°K. Clearly forces are keeping Earth 75°K (167°F) warmer and 202°K(392°F) cooler than the Moon.
The Carbon climate forcing debate his a three sided event, where two sides argue over the degree of CO2 warming and the third side that the “back radiation forcing” is a fiction. I recently attended the Heartland International Climate Change Convention where I got to have a first hand exchange with the Luke Little Warmers. I brought along a copy of the Atmospheric Absorption Graph below and was met with “Yes, we’ve all seen that before”, or “Reduced cooling is warming”, or “We are only claiming a very small warming”.
The dark, smooth curved line at the top of the graph indicates the ideal Planck curve for the Sun and is in correlation to the top yellow line of the graph. The yellow area is energy absorbed by the atmosphere, at least 30% of the incoming energy. The red area is the energy that impacts Earth’s surface. Rather than inform the masses on the actual nature of absorption and the variation with the gas, liquid and solid states of matter, the climate alchemy elites let the misconception of absorption as a long term effect set part of the Carbon forcing myth. Incoming solar radiation is absorbed by Ozone, Oxygen, Carbon Dioxide and water vapor, which we will deal with individually. Wikipedia has a general analysis on the Atmospheric Absorption process [2] which we will be providing data from, but Wiki readers are cautioned that this ‘independent’ group is guilty of egregious distortions with regard to climate data [3]. The Wiki claims in this linked poston greenhouse gases, and particularly the 70% GHG warming from water vapor, will be exposed.
Ozone in the high atmosphere absorbs life damaging UV light in the 200 to 360 nanometer and the 450 to 750 nm ranges. Ozone has a half life of 30 minutes and is constantly destroyed and replaced. Ground level ozone has proven effective in absorbing UV that thin layers in the atmosphere did not absorb. Paris has used Ozone for water purification for over a century and more than a thousand cities have this system today. EPA claims of negative effects of ground level Ozone may be hyperbole. Oxygen absorbs energy in the 50 to 242 nm range. Carbon Dioxide absorbs in the 1400, 1600 and 2000nm range, but with its low Infrared emission, based on its low 210°to 310°K temperature range, the Earth only emits energy in ONE CO2 absorption range. The CO2 molecule is linear, with central Carbon atom and one Oxygen atom, exactly opposite each other.With this molecule structure, CO2 has only one vibrational mode, and absorption results in a billionth of a second vibration, followed by an emission, which due to the Laws of Energy Conservation, MUST be lower energy and longer wavelength. The now excited CO2 molecule then releases this excess energy to the adjoining 79% atmospheric Nitrogen and 19% atmospheric Oxygen. This energy is then removed from the lower atmosphere to the upper by convective currents and does NOT travel down to the Earth. The planet wide lapse rate of 2°C (3°F) for every 1000 ft of altitude increase is proof that this energy is being removed in accordance with the Laws of Thermodynamics.
Now to the greatest buffering factor in Earth’s temperature, water vapor. As shown in red on the graph, water absorbs almost continuously from the 200 nm to the 2500 nm range, including the three absorption bands for CO2. From Wiki, “HITRON spectroscopy shows 37,000 spectral lines for gaseous H2O from the micro wave to the visible spectrum”. This does not include the massive number of absorption bands by water vapor in the Infrared range. Per Wiki, water has multiple tational, vibrational and electronic absorption states in multiple EMR bands. What the climate alchemists have tried to get humanity to believe is that the ONE band of Earth emitted IR absorbed by CO2 and water vapor in the 2000 nm range is the governing factor in climate. While it is axiomatic that ‘delayed warming is cooling’,it is false to assert that ‘delayed cooling is warming’ as we will discuss.
Temperature is a measure of the local kinetic energy of gas, liquid or solid matter and higher temperature is more movement, or more energy. It is correct to say that delaying the transfer of heat will result in a lower energy, cooler body. It is incorrect to say that delaying cooling is ‘heating’ as no energy is flowing back from the insulating material. Your body radiates IR energy and mirrors can reflect IR energy, but your energy reflected back on your body will NOT increase your temperature. Wrapping yourself in blankets, or mylar will reduce your convective loss in a cool environment, but cannot warm you by radiant energy. Liquid water also absorbs in a range of solar energy bands and when sufficiently excited transforms from liquid to gas, absorbing surface energy 2,270 kJ/kg of energy by Latent Heat of Vaporization and releasing that energy at high altitude by Latent Heat of Condensation. This same mechanism is constantly transferring daytime solar heating from the cloud base and solar facing side to the cloud tops [4]. For anyone to assert that water vapor, liquid water or the hydrological cycle is in any way an Earth warming factor is preposterous. Having described the Earth’s thermal buffering systems we will examine the second forcing system.
In January, 2013, Russian scientists successfully drilled through 4,000 meters of ice at Lake Vostok into warm water with over 3,500 unique gene sequences [5]. While working at this location, these scientists recorded the lowest temperature ever for Earth, -89.2°C (-128.6°F or 184°K), on July 21, 1983, which brings up several questions. Why is the coldest temperature on Earth more than 150°K warmer than the equal solar input to the Lunar poles ? With such a low surface temperature, in the Antarctic winter, why was there liquid water under 2 miles of ice ? Why were there ANY life forms with no light and no traditional forms of nutrition?
Earth is cooler than the Moon due to the buffering effects of liquid and gaseous water. Earth is warmer than the Moon due to variable rate, internal fission which is linked to variable solar particle bombardments and partially shielded by a varying magnetosphere [6]. Life exists at this extreme condition because single celled Archaea are able to digest fission byproducts, including Methane and form the base of the food chain for much Antarctica, including the Lake Vostok multi-celled life forms [7].
Also at the Heartland ICCC event was a college professor who has analyzed the 30 years of NOAA satellite temperature data and the US Geologic seismic data and found a startling correlation. This research involves two publicly available data sets with over 100,000 points each, standard statistical analysis, and is currently under peer review. If rejected it will only be for political reasons and will be submitted to other, less political venues. If you can convince yourself that ONE Earth emitted band of CO2 and water vapor absorbed energy can over-power the +50,000 bands of water vapor absorbed sunlight, then you deserve the faux reality that this Ptolemaic Greenhouse Gas Model, and the feudal future science that this mindset will deliver.
Joseph A Olson, PE Aug 4, 2014
[1] “Lunar Equator Surface Temperature and Regolith Profile” by Vasavada, et al Journal of Geophysical Research, Vol 117 [2] en.wikipedia.org/wiki/Electromagnetic_Absorption_by_Water [3] wattsupwiththat.com/2009/12/19/wikibullies-at-work-the-national-post-exposes broad-trust-issues-over-wikipedia-climate-information/ [4] Science Goes Over Under, Inside Out at Principia-scientific.org [5] russiatoday.com/news/lake-vostok-bacteria-dan-745 [6] covered in multiple articles beginning with “Motive Force for All Climate Change” at ClimateRealist.com and others under the Geo-nuclear tab at FauxScienceSlayer.com [7] “New ! Amazing ! Wrongco Proxy Crock” and “Proxy Crock Memos” in archive at Canada Free Press
That is not what he says. He clearly states where the energy comes from and where it goes.
When you can't beat his arguments, lie about them.
quote
Originally posted by FlyinFieros:
Bob Tisdale? Seriously?
His "argument" is El Nino creates energy and La Nina destroys energy.
That violates the first law of thermodynamics. Where does he think the energy comes from? Earth's climate system is still gaining energy. More energy is staying then leaving. His entire theory falls completely apart with the fact alone. There's also a long series of posts at Skeptical Science where Tisdale attempts to pitch his laughable theory and gets totally wrecked.
Originally posted by Doug85GT: That is not what he says. He clearly states where the energy comes from and where it goes.
If it's so clear, state them for us.
You're claiming some conspiracy blogger is overthrowing the entire scientific community's understanding. The burden of proof is on you. Since Tisdale himself is unwilling to explain where the massive amount of ocean heat content is coming from, how about you take up the task.
[This message has been edited by FlyinFieros (edited 11-25-2014).]
Originally posted byBob Tisdale skywatcher at 138 says: “1: Where's the heat coming from? The oceans, globally, are warming, the atmosphere is warming, and yet the Sun is not getting any brighter. What's your energy source?” The sun is the primary energy source, but sea surface and ocean heat content warming can and do also take place without the exchange of heat, which is the result of teleconnections. The process through which the sun creates the warm water for El Niño events was described in my comment 139, where I replied to composer99:
El Niño and La Niña events are part of a coupled ocean-atmosphere process. Sea surface temperatures, trade winds, cloud cover, downward shortwave radiation (aka visible sunlight), ocean heat content, and subsurface ocean processes (upwelling, subsurface currents, thermocline depth, downwelling and upwelling Kelvin waves, etc.) all interact. They’re dependent on one another. During a La Nina, trade winds are stronger than normal. The stronger trade winds reduce cloud cover, which, in turn, allows more downward shortwave radiation to enter and warm the tropical Pacific.
If you’re having trouble with my explanation because it’s so simple, refer to Pavlakis et al (2008) paper “ENSO Surface Shortwave Radiation Forcing over the Tropical Pacific.” Note the inverse relationship between downward shortwave radiation and the sea surface temperature anomalies of the NINO3.4 region in their Figure 6. During El Niño events, warm water from the surface and below the surface of the West Pacific Warm Pool slosh east, so the sea surface temperatures of the NINO3.4 region warm, causing more evaporation and more clouds, which reduce downward shortwave radiation. During La Niña events, stronger trade winds cause more upwelling of cool water from below the surface of the eastern equatorial Pacific, so sea surface temperature to drop in the NINO3.4 region, in turn causing less evaporation. The stronger trade winds also push cloud cover farther to the west than normal. As a result of the reduced cloud cover, more downward shortwave radiation is allowed to enter and warm the tropical Pacific during La Niña events.
To complement that, here’s a graph to show the interrelationship between the sea surface temperature anomalies of the NINO3.4 region and cloud cover for the regions presented by Pavlakis et al. That discussion explains why the long-term warming of the Ocean Heat Content for the tropical Pacific was caused by the 3-year La Nina events and the unusual 1995/96 La Niña. First, here’s a graph of tropical Pacific Ocean Heat Content. It’s color coded to isolate the data between and after the 3-year La Niña events of 1954-57, 1973-76 and 1998-2001. Those La Niña events are shown in red. Note how the ocean heat content there cools between the 3-year La Niña events. Anyone who understands ENSO would easily comprehend how and why that happens. It’s tough to claim that greenhouse gases have caused the warming of the tropical Pacific when the tropical Pacific cools for multidecadal periods between the 3-year La Niñas, Composer99. As you can see, the warming that took place during the 1995/96 La Niña was freakish. Refer to McPhaden 1999 “Genesis and Evolution of the 1997-98 El Niño”.
McPhaden writes:
For at least a year before the onset of the 1997–98 El Niño, there was a buildup of heat content in the western equatorial Pacific due to stronger than normal trade winds associated with a weak La Niña in 1995–96.
Based on the earlier description, that “build up of heat content” resulted from the interdependence of trade winds, cloud cover, downward shortwave radiation and ocean heat content. Simple. As you can see in the above graph, the upward spike caused by the 1995/96 La Niña skews the trend of the mid-cooling period, and if we eliminate the data associated with it and the 1997/98 El Niño, then the trend line for the mid-period falls into line with the others.
HHH
skywatcher, so La Niña events provide the naturally created fuel for El Niño events. More ENSO basics: An El Niño releases that heat, which is stored as warm water, from below the surface of the West Pacific Warm Pool. The warm water travels east and spreads across the surface of the eastern tropical Pacific. The El Niño releases heat through evaporation into the atmosphere, which is why tropical Pacific ocean heat content drops during an El Niño. Additionally, the convection, cloud cover and precipitation accompany that warm water east, sometimes almost halfway around the globe. These changes in location of the primary source of tropical Pacific convection and the resulting changes in atmospheric circulation, not a direct transfer of heat, are what cause surface temperatures to warm in areas remote to the eastern tropical Pacific.
quote
Originally posted by FlyinFieros:
If it's so clear, state them for us.
You're claiming some conspiracy blogger is overthrowing the entire scientific community's understanding. The burden of proof is on you. Since Tisdale himself is unwilling to explain where the massive amount of ocean heat content is coming from, how about you take up the task.
[This message has been edited by Doug85GT (edited 11-25-2014).]
Antarctica's ice paradox has yet another puzzling layer. Not only is the amount of sea ice increasing each year, but an underwater robot now shows the ice is also much thicker than was previously thought, a new study reports.
The discovery adds to the ongoing mystery of Antarctica's expanding sea ice. According to climate models, the region's sea ice should be shrinking each year because of global warming. Instead, satellite observations show the ice is expanding, and the continent's sea ice has set new records for the past three winters. At the same time, Antarctica's ice sheet (the glacial ice on land) is melting and retreating.
Measuring sea ice thickness is a crucial step in understanding what's driving the growth of sea ice, said study co-author Ted Maksym, an oceanographer at the Woods Hole Oceanographic Institution in Massachusetts. Climate scientists need to know if the sea ice expansion also includes underwater thickening. [Album: Stunning Photos of Antarctic Ice]
"If we don't know how much ice is there is, we can't validate the models we use to understand the global climate," Maksym told Live Science. "It looks like there are significant areas of thick ice that are probably not accounted for."
The findings were published today (Nov. 24) in the journal Nature Geoscience.
Like icebergs, much of Antarctica's floating sea ice is underwater, hidden from satellites that track seasonal sea ice. And it's difficult to take direct measurements from ships or drilling, because the thickest ice is also the hardest to reach, Maksym said.
View galleryRobot Sub Finds Surprisingly Thick Antarctic Sea I … The robot submarine ready for launch from an icebreaker offshore Antarctica. The researchers were stuck aboard an icebreaker in 20-foot-thick (6 meters) pack ice for more than a week after taking advantage of a lead, or open water, that accessed thick ice, he said. "Obviously that carried some risk, and we were stuck until the wind changed direction again," he said.
Pinging the ice
Over the last four years, the international group of researchers has mapped the bottom of sea ice with an underwater robot, or autonomous underwater vehicle (AUV), during two research cruises offshore Antarctica. The AUV can swim to a depth of about 100 feet (30 m) and has upward-looking sonar to survey the bottom of the sea ice.
"With the AUV, you can get under ice that is either difficult to access or difficult to drill, and in each region, we found some really thick ice, thicker than had been measured anywhere else," Maksym said.
Almost all of the sea ice that forms during the Antarctic winter melts during the summer, so scientists had assumed most of the ice never grew very thick. Previous studies suggested the ice was usually 3 to 6 feet (1 to 2 m) thick, with a few rare spots reaching up to 16 feet (5 m) in thickness. For comparison, most of the Arctic sea ice is twice as thick (6 to 9 feet, or 2 to 3 m), with some regions covered with 12 to 15 feet (4 to 5 m) of ice. [50 Amazing Facts About Antarctica]
The robot sub surveys, which were spot-checked by drilling and shipboard tests, suggest Antarctica's average ice thickness is considerably higher than previous estimates. On average, the thickness of the ice was 4.6 to 18 feet (1.4 to 5.5 m). In the three regions it surveyed, the robot sub found that deformed, thickened ice accounted for at least half of and as much as 76 percent of the total ice volume, the researchers report.
"Our study shows that we're probably missing some of this thick ice, and we need to try to account for that when we try to compare what we see in models and satellites to what we see in the field," Maksym said.
The thickest ice measured during the survey was about 65 feet (20 m) thick, in the Bellingshausen Sea, Maksym told Live Science. In the Weddell Sea, the maximum ice thickness hit more than 45 feet (14 m), and offshore of Wilkes Land, the ice was about 53 feet (16 m) thick.
Next steps
These thick, craggy floes likely wouldn't exist without the fierce winds that circle Antarctica from west to east, the researchers said. Winter storms bash up the ice, freezing and reforming the rubble into new, thicker ice. "It must have been crunched up a tremendous amount and [the floes] piled up on top of each other," Maksym said. "The ice can generate enormous amounts of force if you have these strong winds. [The wind] is like an accordion, stretching it out and squishing it back together again."
The researchers' next step is to measure how much of Antarctica's total sea ice this thick ice represents. Maksym said it could be a "reasonably significant area of the pack."
The sea ice growth around Antarctica has averaged about 1.2 percent to 1.8 percent per decade between 1979 and 2012, according to the 2013 Intergovernmental Panel on Climate Change's Fifth Assessment Report. The increases are concentrated primarily in the Ross Sea in western Antarctica. Sea ice in the nearby Bellingshausen and Amundsen seas has significantly decreased. Researchers suspect these regional differences could result from stronger winds or increased meltwater from the Antarctic ice sheet, or a combination of both factors.
(NaturalNews) Thank goodness carbon dioxide levels are finally rising ever so slightly in our atmosphere, bringing much-needed carbon dioxide to the plants and forests of the world which have been starving for CO2. The lack of CO2 in the atmosphere is one of the most devastating limiting factors for plant growth and reforestation of the planet, and at just 400ppm -- that's just 400 micrograms per kilogram -- carbon dioxide is so low that Earth's plant life can barely breathe.
Editor's note: I have added substantially to this story since it was first published in order to attempt to educate what appear to be a mass of brainwashed, mathematically illiterate commenters on Facebook who demonstrate a wholesale inability to process information with anything resembling rationality on this subject.
Let me clarify three things before we even get into the story:
#1 - NO, I do not support the coal and oil industry, and in fact I think they are terrible polluters of our planet for lots of reasons that have nothing to do with CO2. As it turns out, all the coal and oil being burned across our world right now only slightly impacts CO2 levels, especially when compared with CO2 emissions by ocean life. So my support of CO2 as an essential plant nutrient in no way is any kind of endorsement of the oil and coal industries. My long track record of activism against corporate monopolists is irrefutably solid.
#2 - YES, CO2 is an essential plant nutrient. Despite all the idiotic beliefs of people who have been brainwashed by Al Gore into believing scientific mythologies, higher CO2 levels support faster plant growth and the re-greening of our planet, period! Anyone who disagrees with this is flatly uninformed, brainwashed or just plain ignorant of plant biology (and that's a lot of people). Recent science is proving that rising CO2 levels are, in fact, expanding plant growth and reforestation around the world. Read Increase in Carbon Dioxide Levels "Greening" the Deserts at NatureWorldNews.com or read the press release from the original researchers out of Australia who documented this correlation. And everybody needs to read www.PlantsNeedCO2.org
#3 - The current level of CO2 in Earth's atmosphere is 400ppm. By comparison, Oxygen exists in the atmosphere at 210,000ppm. When you exhale, your own breath contains 40,000ppm of CO2, and if you know anything about emergency first aid, then you know that breathing this 40,000ppm of CO2 into another person's body (mouth-to-mouth resuscitation) is a lifesaving action. It's not uncommon for CO2 to reach levels of 3000ppm in homes, schools and offices. OSHA allows workers to work in environments with up to 5000ppm of CO2. (Because, again, oxygen is present at 210,000ppm, vastly out-weighing the CO2.)
So all this talk of carbon dioxide threatening the entire planet at just 400ppm -- less than one-half of 1/1000th of the air -- is pure nonsense. Total quack science fearmongering.
In fact, most of what we've all been told about CO2 over the pat few years is a complete lie. It's time to stop believing these lies and wake up to reality. Most importantly, stop defending the CO2 / global warming hoax. Yes, CO2 is rising, but it's mostly from non-human activity, and rising levels actually support forests and plants everywhere.
How did I "wake up" to this information? It's simple: I used to be a believer in the CO2 hoax until I really began to study plant physiology and aquaponics production. Only then did I discover that CO2 is a vital nutrient for plant growth and that levels of CO2 in the atmosphere were radically deficient for optimal reforestation and plant biology. My awakening to this in no way means I endorse coal or oil industries, both of which are dirty polluters of the planet. But I am no longer allowing myself to be conned by the likes of Al Gore who has successfully convinced far too many people that their own breath is a global pollutant that needs to be regulated and taxed.
The CO2 scam is nothing more than a global tax moneymaking scheme being pushed by people who hope to get rich off our collective guilt for a problem that's entirely fabricated and fictional.
My original story continues here:
Throughout the history of our planet, atmospheric CO2 was much, much higher, and it supported eras of lush rainforests, rapid plant growth and far greater biodiversity than what we see today. In fact, 525 million years ago, Earth's atmospheric CO2 levels were as high at 7,000 ppm -- and far from the planet "dying" as global warming hoax pushers try to claim, it was one of the most lush and biodiverse times in our planet's history.
Claims that weather forecasts are reasonably accurate up to 48 hours are based on measured results for fair weather. Results for severe weather, which are really what is important for people, are very poor. The Intergovernmental Panel on Climate Change (IPCC) has a worse record for both. Every prediction/projection since their first Report in 1990 has been wrong, with claims for more severe weather part of that failure. They fail because of fundamental errors in assumptions and mechanics. Essex and McKitrick identified the challenge of turbulence in building climate models.
Climate research is anything but a routine application of classical theories like fluid mechanics, even though some may be tempted to think it is. Furthermore, experiment and theory have been struggling since the 19th century, literally for generations, with a complicated behavior of fluids call turbulence.
The experiments are bedeviled by the fact that a turbulent fluid is active on scales smaller than the size of the finest experimental probes. Thus the measurements themselves are not of the actual variables but of some kind of unspecified, instrument-dependent average of the variables, and only one small region of the fluid.
They are talking about turbulence at all scales. Severe weather is large-scale turbulence with basic triggers that convert laminar flow to turbulent flow. This is caused, by the following, among other conditions, 1. Rough terrain, such as the effect of the Rocky Mountains or the Andes on the Westerlies. 2. Transition of surface, such as from land to ocean, like in the Cape Hatteras area. 3. Transition of surface, such as from cool to warm ocean – this is the major driving mechanism in transformation of equatorial depressions to Tropical storms to hurricanes. 4. Different temperatures between air masses. 5. Different convergence and divergence along a Frontal zone. Figure 1 shows a cross-section of energy balance from Pole to Pole.
It illustrates the average condition at present. Salient features include the areas of surplus and deficit energy and the point of zero energy balance (ZEB). It is different between the Hemispheres, 38N and 40S, because of different land-water ratios. The ZEB is coincident with some important boundaries.
-The snowline (summer and winter). – The pole ward limit of trees. – The location of the Circumpolar Vortex (Jet Stream). – The major air mass boundary – the Polar Front. Figure 2 shows the Polar Front as a simple division of the atmosphere between cold polar and warm tropical air. The pattern is the same for the Southern Hemisphere. It shows the approximate juxtaposition of the Jet Stream and the Front.
Because of the temperature difference across the Front, sometimes called the Zonal Index, it marks the area of most severe weather. These take the form of mid-latitude cyclones, with associated tornados. Intensity of the storm is directly related to the temperature and moisture contrast across the Front.
The IPCC argue that global warming is inevitable because CO2 levels will continue to rise from human activity. They also claim, warming will be greater in the polar region. If true, then temperature contrast across the Polar Front is lower and energy potential for severe weather reduced. Figure 1 shows the average position of the ZEB, while Figure 4 shows the average seasonal latitudinal shift in the northern hemisphere, between approximately 35N in winter, and 65°N in summer.
Changes in these latitudes trigger changes in the dynamics created by rotational forces and the area of the surface affected. This is reflected in the changes to the angle of solar incidence variation caused by changing obliquity of the ecliptic (tilt). The Arctic and Antarctic Circles are at 66.5° N and S, the point at which the sun’s rays are tangential at Equinox. But this is only if you accept the angle of tilt as 23.5°. Almanacs list it currently at 23.4° and decreasing at 0.47” per century. The mean position of the ZEB shifts more as the global energy balance changes.
The mid-latitude cyclones that form as wave like patterns and migrate along the Polar Front, are major storm systems that occur more frequently and can impact much larger areas than any other severe weather system. Figure 5 shows a comparison between a mid-latitude cyclone and a hurricane.
A large system can cover up to 5000 km, with damaging winds, heavy rain, snow and freezing rain. Historic records of damage from these storms, is well documented for the US by David Ludlum . Similarly, details of such extreme examples for Europe include the 1588 storm that destroyed the Spanish Armada, well documented by J.A. Kington, and the storm of 1703 that hit England and Europe. Daniel Defoe traveled around England recording the damage in his book The Storm.
Systems are also important in mixing air between the surplus and deficit energy sectors, horizontally and vertically. Intensity of these systems is also defined by the temperature contrast across the Front. In the list of triggers (above) item 5 lists divergence and convergence as mechanism for development. Figure 6 shows the relationship between these and the surface development of the cyclone. As the wave like system develops a low pressure center is formed and a rotational effect is generated. The cold air dictates its momentum, because it is denser and heavier than the warm air. The Warm Front is defined by cold air retreating, and the Cold Front by cold air advancing.
The advancing Cold Front acts like a bulldozer pushing already unstable convective cells, cumulonimbus, into extreme instability creating conditions for spawning tornados. Since the cold air is dominant then any decrease in its temperature relative to the warm air is going to have an effect. An indicator of the difficulty, with turbulence created phenomena, is what happens with mid-latitude cyclones. A full cycle involves four stages.
1. Cyclogenesis, initiation of the wave. 2. Mature Stage with maximum low pressure and wind speeds. 3. Occluded Stage when the Cold Front advances rapidly and lifts the Warm Front above the surface. 4. Frontolysis when a small pool of warm air is trapped above the surface and the surface low pressure dissipates.
Cyclogenesis occurs quite often, but few systems go through the few cycle. An important question is how do you model a system that starts out sub grid size, but may expand to over a few grids?
A shift from Zonal to Meridional Flow in the Rossby Wave pattern of the Circumpolar Vortex will affect all the factors listed (1-5) that trigger mid-latitude cyclones. Development, track and intensity of these cyclones in the North Atlantic was a major focus of H. H. Lamb’s research beginning with his 1950 paper, “Types and spells of weather around the year in the British Isles”. Lamb also knew that a latitudinal shift in the Polar Front results in a change in the Coriolis Effect (creating an apparent force), as it decreases from zero at the Equator to maximum at the Poles.
Essex and McKitrick identified turbulence as a serious challenge for understanding climatology. They spoke to the problem at all levels, …experiment and theory have been struggling since the 19th century, literally for generations, with a complicated behavior of fluids called turbulence. When a fluid is turbulent, (nearly all fluids are), not only are we unable to provide solutions of Navier – Stokes to confirm the behaviour theoretically, but we are also unable to experimentally measure the conditions in the fluid in such a way that we can fully capture what is going on.
The major factors inducing turbulence in laminar flow, and thereby severe weather, are the rough surface and contact zones of hot and cold air and water. One of the largest contact zones is the Polar Front between cold polar air and warm tropical air. Intensity of severe weather along the Front is a function of the temperature difference between the air masses. The IPCC claim this will decrease with global warming as the polar air warms more than the tropical air. Theoretically this creates fewer storms, but the IPCC are predicting more. So far the evidence of less severe weather seems to support the basic concepts, not the IPCC.